The customer journey involves multiple interactions between the customer and the merchant or service provider.
We call each interaction in the customer journey a touch point.
According to Salesforce.com, it takes, on average, six to eight touches to generate a lead in the B2B space.
The number of touchpoints is even higher for a customer purchase.
Multi-touch attribution is the mechanism to evaluate each touch point’s contribution toward conversion and gives the appropriate credits to every touch point involved in the customer journey.
Conducting a multi-touch attribution analysis can help marketers understand the customer journey and identify opportunities to further optimize the conversion paths.
In this article, you will learn the basics of multi-touch attribution, and the steps of conducting multi-touch attribution analysis with easily accessible tools.
What To Consider Before Conducting Multi-Touch Attribution Analysis
Define The Business Objective
What do you want to achieve from the multi-touch attribution analysis?
Do you want to evaluate the return on investment (ROI) of a particular marketing channel, understand your customer’s journey, or identify critical pages on your website for A/B testing?
Different business objectives may require different attribution analysis approaches.
Defining what you want to achieve from the beginning helps you get the results faster.
Define Conversion
Conversion is the desired action you want your customers to take.
For ecommerce sites, it’s usually making a purchase, defined by the order completion event.
For other industries, it may be an account sign-up or a subscription.
Different types of conversion likely have different conversion paths.
If you want to perform multi-touch attribution on multiple desired actions, I would recommend separating them into different analyses to avoid confusion.
Define Touch Point
Touch point could be any interaction between your brand and your customers.
If this is your first time running a multi-touch attribution analysis, I would recommend defining it as a visit to your website from a particular marketing channel. Channel-based attribution is easy to conduct, and it could give you an overview of the customer journey.
If you want to understand how your customers interact with your website, I would recommend defining touchpoints based on pageviews on your website.
If you want to include interactions outside of the website, such as mobile app installation, email open, or social engagement, you can incorporate those events in your touch point definition, as long as you have the data.
Regardless of your touch point definition, the attribution mechanism is the same. The more granular the touch points are defined, the more detailed the attribution analysis is.
In this guide, we’ll focus on channel-based and pageview-based attribution.
You’ll learn about how to use Google Analytics and another open-source tool to conduct those attribution analyses.
An Introduction To Multi-Touch Attribution Models
The ways of crediting touch points for their contributions to conversion are called attribution models.
The simplest attribution model is to give all the credit to either the first touch point, for bringing in the customer initially, or the last touch point, for driving the conversion.
These two models are called the first-touch attribution model and the last-touch attribution model, respectively.
Obviously, neither the first-touch nor the last-touch attribution model is “fair” to the rest of the touch points.
Then, how about allocating credit evenly across all touch points involved in converting a customer? That sounds reasonable – and this is exactly how the linear attribution model works.
However, allocating credit evenly across all touch points assumes the touch points are equally important, which doesn’t seem “fair”, either.
Some argue the touch points near the end of the conversion paths are more important, while others are in favor of the opposite. As a result, we have the position-based attribution model that allows marketers to give different weights to touchpoints based on their locations in the conversion paths.
All the models mentioned above are under the category of heuristic, or rule-based, attribution models.
In addition to heuristic models, we have another model category called data-driven attribution, which is now the default model used in Google Analytics.
What Is Data-Driven Attribution?
How is data-driven attribution different from the heuristic attribution models?
Here are some highlights of the differences:
- In a heuristic model, the rule of attribution is predetermined. Regardless of first-touch, last-touch, linear, or position-based model, the attribution rules are set in advance and then applied to the data. In a data-driven attribution model, the attribution rule is created based on historical data, and therefore, it is unique for each scenario.
- A heuristic model looks at only the paths that lead to a conversion and ignores the non-converting paths. A data-driven model uses data from both converting and non-converting paths.
- A heuristic model attributes conversions to a channel based on how many touches a touch point has with respect to the attribution rules. In a data-driven model, the attribution is made based on the effect of the touches of each touch point.
How To Evaluate The Effect Of A Touch Point
A common algorithm used by data-driven attribution is called Markov Chain. At the heart of the Markov Chain algorithm is a concept called the Removal Effect.
The Removal Effect, as the name suggests, is the impact on conversion rate when a touch point is removed from the pathing data.
This article will not go into the mathematical details of the Markov Chain algorithm.
Below is an example illustrating how the algorithm attributes conversion to each touch point.
The Removal Effect
Assuming we have a scenario where there are 100 conversions from 1,000 visitors coming to a website via 3 channels, Channel A, B, & C. In this case, the conversion rate is 10%.
Intuitively, if a certain channel is removed from the conversion paths, those paths involving that particular channel will be “cut off” and end with fewer conversions overall.
If the conversion rate is lowered to 5%, 2%, and 1% when Channels A, B, & C are removed from the data, respectively, we can calculate the Removal Effect as the percentage decrease of the conversion rate when a particular channel is removed using the formula:
Then, the last step is attributing conversions to each channel based on the share of the Removal Effect of each channel. Here is the attribution result:
| Channel | Removal Effect | Share of Removal Effect | Attributed Conversions |
| A | 1 – (5% / 10%) = 0.5 | 0.5 / (0.5 + 0.8 + 0.9) = 0.23 | 100 * 0.23 = 23 |
| B | 1 – (2% / 10%) = 0.8 | 0.8 / (0.5 + 0.8 + 0.9) = 0.36 | 100 * 0.36 = 36 |
| C | 1 – (1% / 10%) = 0.9 | 0.9 / (0.5 + 0.8 + 0.9) = 0.41 | 100 * 0.41 = 41 |
In a nutshell, data-driven attribution does not rely on the number or position of the touch points but on the impact of those touch points on conversion as the basis of attribution.
Multi-Touch Attribution With Google Analytics
Enough of theories, let’s look at how we can use the ubiquitous Google Analytics to conduct multi-touch attribution analysis.
As Google will stop supporting Universal Analytics (UA) from July 2023, this tutorial will be based on Google Analytics 4 (GA4) and we’ll use Google’s Merchandise Store demo account as an example.
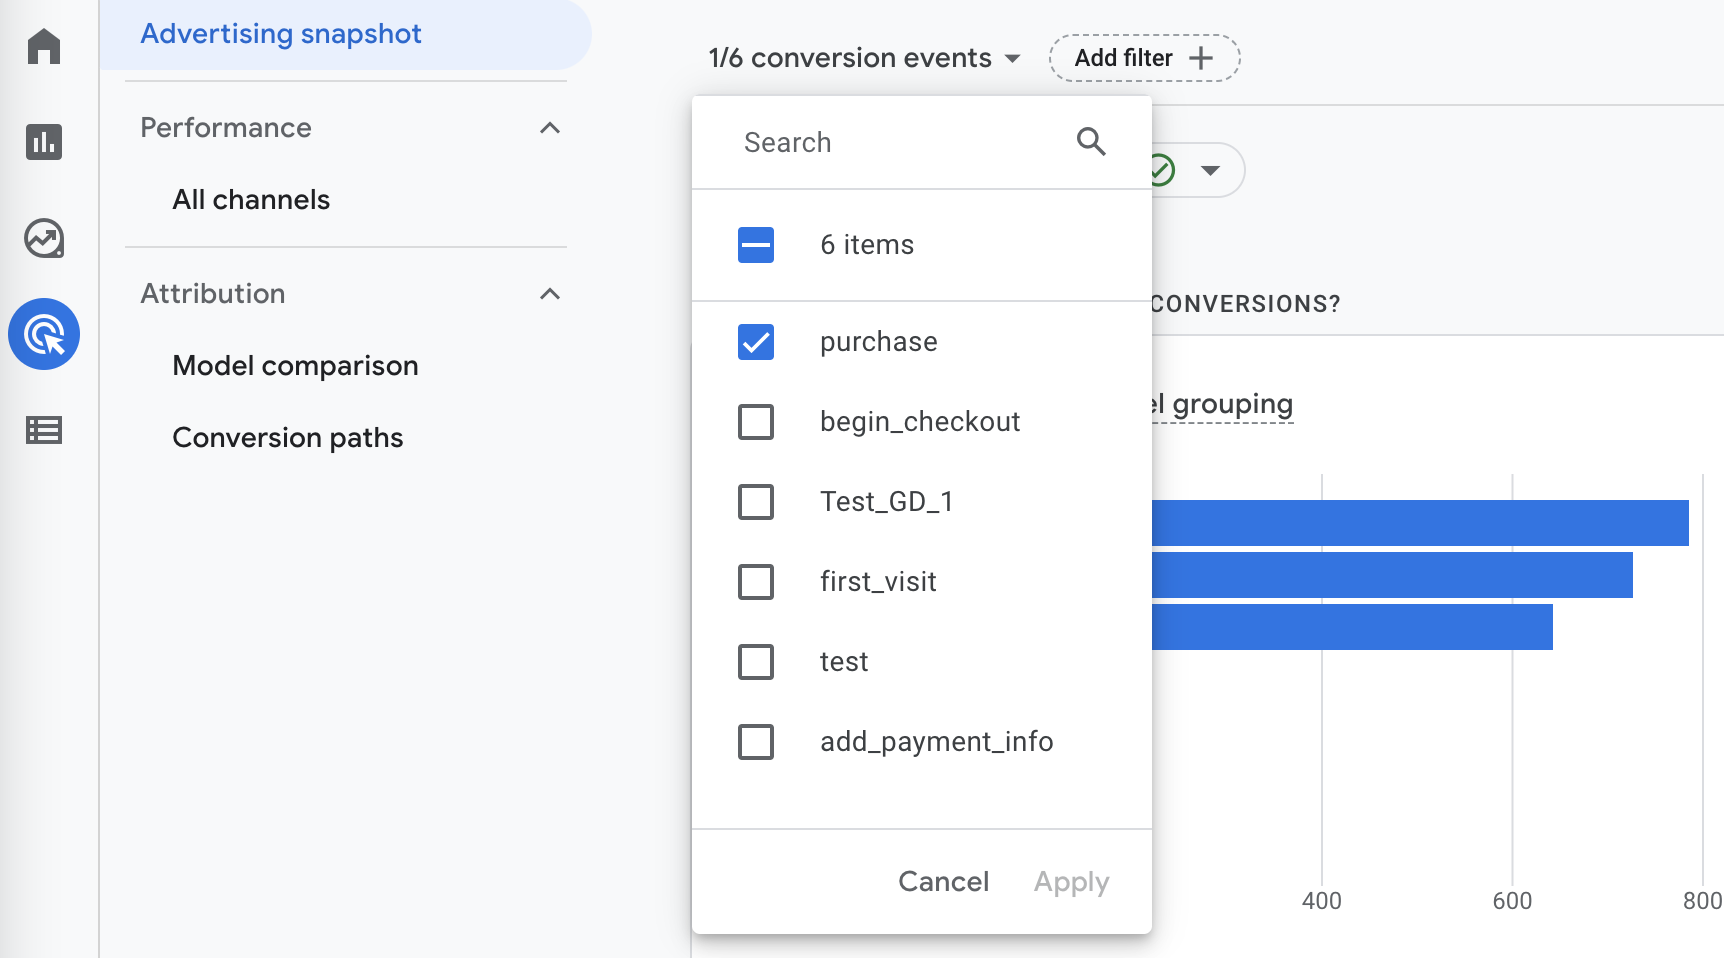
In GA4, the attribution reports are under Advertising Snapshot as shown below on the left navigation menu.
After landing on the Advertising Snapshot page, the first step is selecting an appropriate conversion event.
GA4, by default, includes all conversion events for its attribution reports.
To avoid confusion, I highly recommend you pick only one conversion event (“purchase” in the below example) for the analysis.
 Screenshot from GA4, November 2022
Understand The Conversion Paths In GA4
Under the Attribution section on the left navigation bar, you can open the Conversion Paths report.
Scroll down to the conversion path table, which shows all the paths leading to conversion.
At the top of this table, you can find the average number of days and number of touch points that lead to conversions.
 Screenshot from GA4, November 2022
In this example, you can see that Google customers take, on average, almost 9 days and 6 visits before making a purchase on its Merchandise Store.
Find Each Channel’s Contribution In GA4
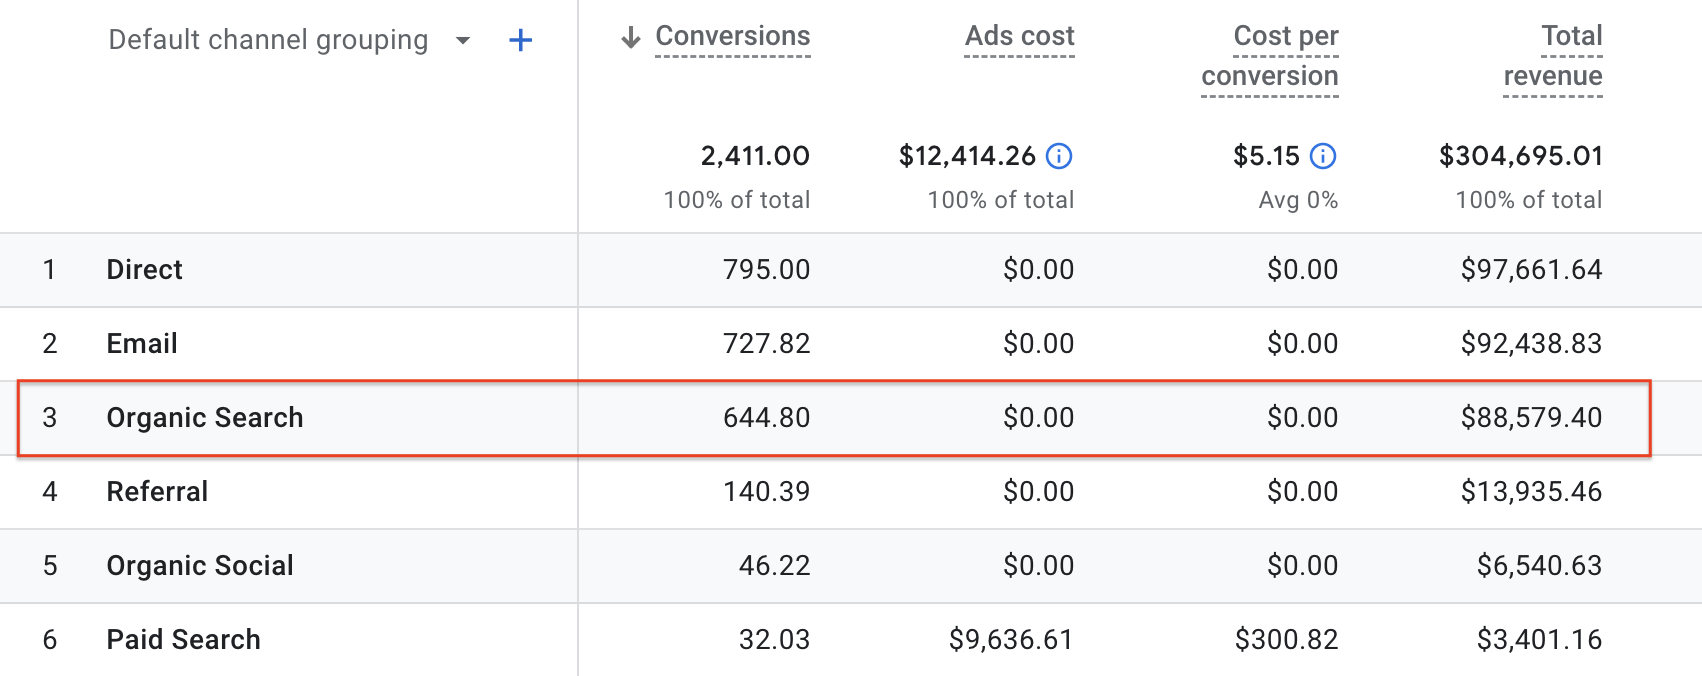
Next, click the All Channels report under the Performance section on the left navigation bar.
In this report, you can find the attributed conversions for each channel of your selected conversion event – “purchase”, in this case.
 Screenshot from GA4, November 2022
Now, you know Organic Search, together with Direct and Email, drove most of the purchases on Google’s Merchandise Store.
Examine Results From Different Attribution Models In GA4
By default, GA4 uses the data-driven attribution model to determine how many credits each channel receives. However, you can examine how different attribution models assign credits for each channel.
Click Model Comparison under the Attribution section on the left navigation bar.
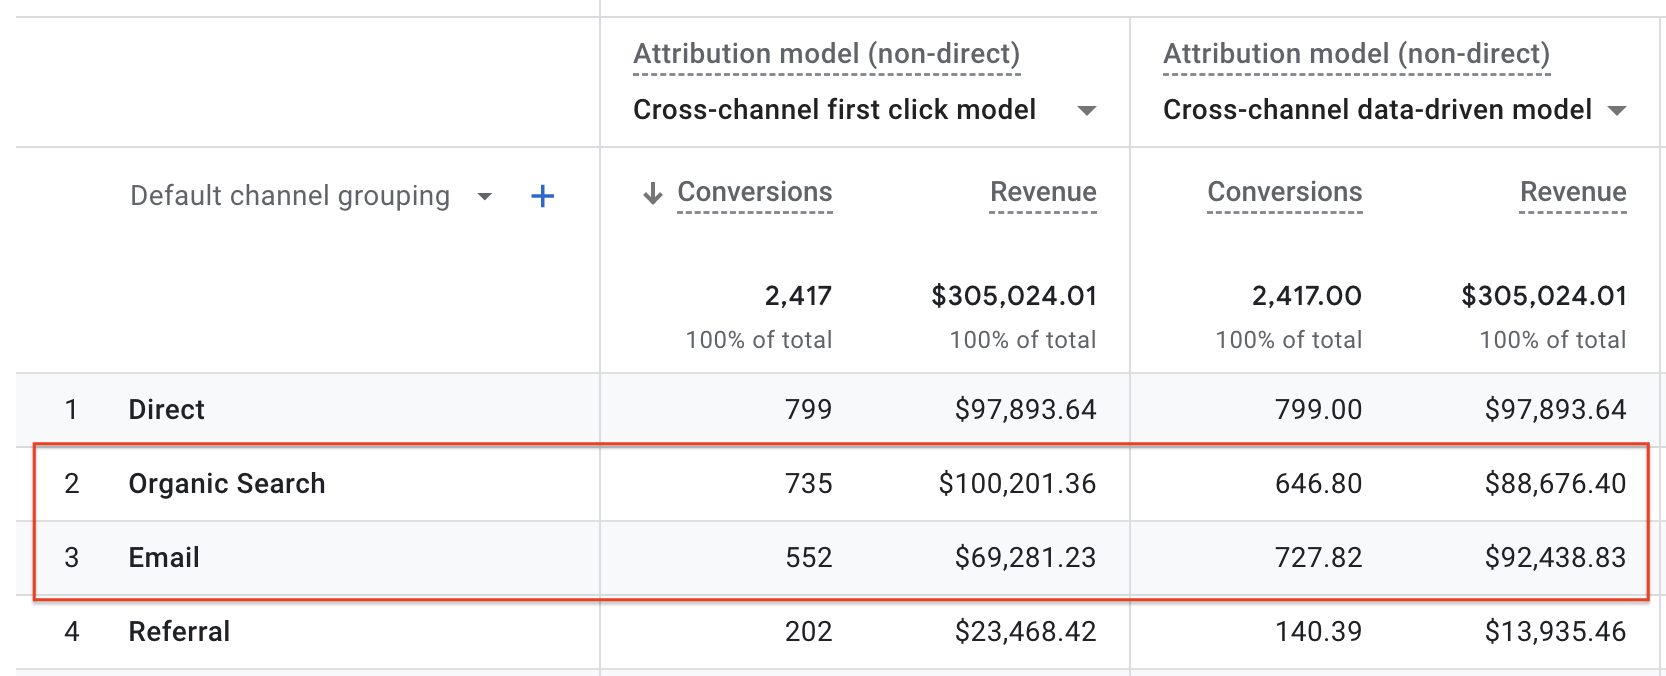
For example, comparing the data-driven attribution model with the first touch attribution model (aka “first click model” in the below figure), you can see more conversions are attributed to Organic Search under the first click model (735) than the data-driven model (646.80).
On the other hand, Email has more attributed conversions under the data-driven attribution model (727.82) than the first click model (552).
 Screenshot from GA4, November 2022
The data tells us that Organic Search plays an important role in bringing potential customers to the store, but it needs help from other channels to convert visitors (i.e., for customers to make actual purchases).
On the other hand, Email, by nature, interacts with visitors who have visited the site before and helps to convert returning visitors who initially came to the site from other channels.
Which Attribution Model Is The Best?
A common question, when it comes to attribution model comparison, is which attribution model is the best. I’d argue this is the wrong question for marketers to ask.
The truth is that no one model is absolutely better than the others as each model illustrates one aspect of the customer journey. Marketers should embrace multiple models as they see fit.
From Channel-Based To Pageview-Based Attribution
Google Analytics is easy to use, but it works well for channel-based attribution.
If you want to further understand how customers navigate through your website before converting, and what pages influence their decisions, you need to conduct attribution analysis on pageviews.
While Google Analytics doesn’t support pageview-based attribution, there are other tools you can use.
We recently performed such a pageview-based attribution analysis on AdRoll’s website and I’d be happy to share with you the steps we went through and what we learned.
Gather Pageview Sequence Data
The first and most challenging step is gathering data on the sequence of pageviews for each visitor on your website.
Most web analytics systems record this data in some form. If your analytics system doesn’t provide a way to extract the data from the user interface, you may need to pull the data from the system’s database.
Similar to the steps we went through on GA4, the first step is defining the conversion. With pageview-based attribution analysis, you also need to identify the pages that are part of the conversion process.
As an example, for an ecommerce site with online purchase as the conversion event, the shopping cart page, the billing page, and the order confirmation page are part of the conversion process, as every conversion goes through those pages.
You should exclude those pages from the pageview data since you don’t need an attribution analysis to tell you those pages are important for converting your customers.
The purpose of this analysis is to understand what pages your potential customers visited prior to the conversion event and how they influenced the customers’ decisions.
Prepare Your Data For Attribution Analysis
Once the data is ready, the next step is to summarize and manipulate your data into the following four-column format. Here is an example.
 Screenshot from author, November 2022
The Path column shows all the pageview sequences. You can use any unique page identifier, but I’d recommend using the url or page path because it allows you to analyze the result by page types using the url structure. “>” is a separator used in between pages.
The Total_Conversions column shows the total number of conversions a particular pageview path led to.
The Total_Conversion_Value column shows the total monetary value of the conversions from a particular pageview path. This column is optional and is mostly applicable to ecommerce sites.
The Total_Null column shows the total number of times a particular pageview path failed to convert.
Build Your Page-Level Attribution Models
To build the attribution models, we leverage the open-source library called ChannelAttribution.
While this library was originally created for use in R and Python programming languages, the authors now provide a free Web app for it, so we can use this library without writing any code.
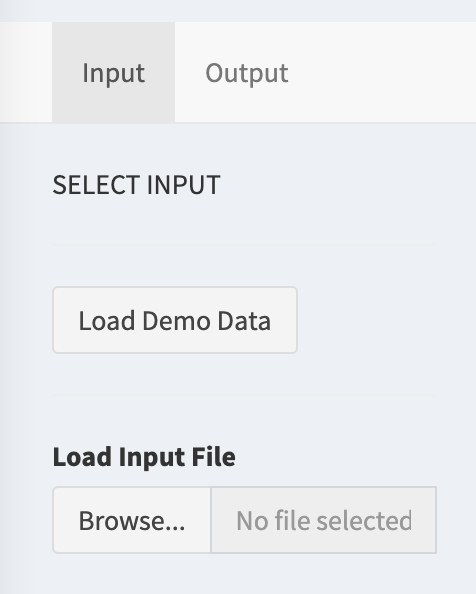
Upon signing into the Web app, you can upload your data and start building the models.
For first-time users, I’d recommend clicking the Load Demo Data button for a trial run. Be sure to examine the parameter configuration with the demo data.
 Screenshot from author, November 2022
When you’re ready, click the Run button to create the models.
Once the models are created, you’ll be directed to the Output tab, which displays the attribution results from four different attribution models – first-touch, last-touch, linear, and data-drive (Markov Chain).
Remember to download the result data for further analysis.
For your reference, while this tool is called ChannelAttribution, it’s not limited to channel-specific data.
Since the attribution modeling mechanism is agnostic to the type of data given to it, it’d attribute conversions to channels if channel-specific data is provided, and to web pages if pageview data is provided.
Analyze Your Attribution Data
Organize Pages Into Page Groups
Depending on the number of pages on your website, it may make more sense to first analyze your attribution data by page groups rather than individual pages.
A page group can contain as few as just one page to as many pages as you want, as long as it makes sense to you.
Taking AdRoll’s website as an example, we have a Homepage group that contains just the homepage and a Blog group that contains all of our blog posts.
For ecommerce sites, you may consider grouping your pages by product categories as well.
Starting with page groups instead of individual pages allows marketers to have an overview of the attribution results across different parts of the website. You can always drill down from the page group to individual pages when needed.
Identify The Entries And Exits Of The Conversion Paths
After all the data preparation and model building, let’s get to the fun part – the analysis.
I’d suggest first identifying the pages that your potential customers enter your website and the pages that direct them to convert by examining the patterns of the first-touch and last-touch attribution models.
Pages with particularly high first-touch and last-touch attribution values are the starting points and endpoints, respectively, of the conversion paths. These are what I call gateway pages.
Make sure these pages are optimized for conversion.
Keep in mind that this type of gateway page may not have very high traffic volume.
For example, as a SaaS platform, AdRoll’s pricing page doesn’t have high traffic volume compared to some other pages on the website but it’s the page many visitors visited before converting.
Find Other Pages With Strong Influence On Customers’ Decisions
After the gateway pages, the next step is to find out what other pages have a high influence on your customers’ decisions.
For this analysis, we look for non-gateway pages with high attribution value under the Markov Chain models.
Taking the group of product feature pages on AdRoll.com as an example, the pattern of their attribution value across the four models (shown below) shows they have the highest attribution value under the Markov Chain model, followed by the linear model.
This is an indication that they are visited in the middle of the conversion paths and played an important role in influencing customers’ decisions.
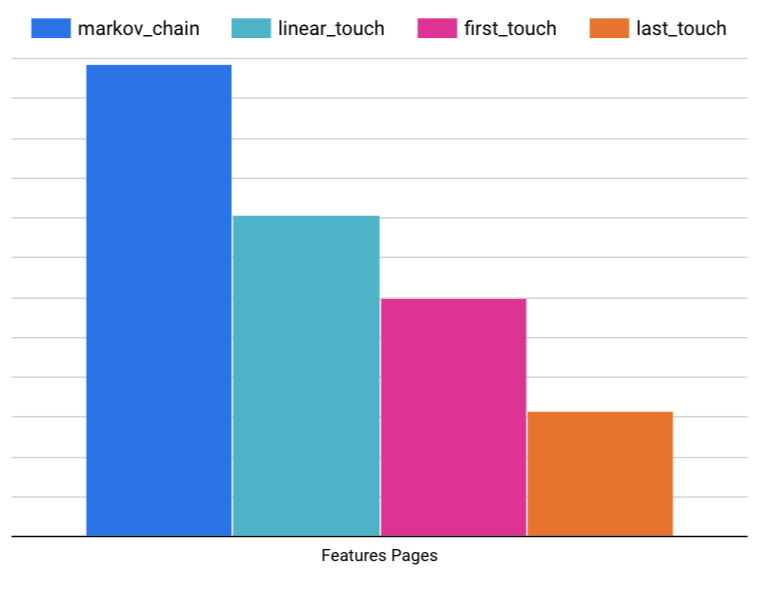 Image from author, November 2022
These types of pages are also prime candidates for conversion rate optimization (CRO).
Making them easier to be discovered by your website visitors and their content more convincing would help lift your conversion rate.
To Recap
Multi-touch attribution allows a company to understand the contribution of various marketing channels and identify opportunities to further optimize the conversion paths.
Start simply with Google Analytics for channel-based attribution. Then, dig deeper into a customer’s pathway to conversion with pageview-based attribution.
Don’t worry about picking the best attribution model.
Leverage multiple attribution models, as each attribution model shows different aspects of the customer journey.
More resources:
Featured Image: Black Salmon/Shutterstock
