
This post was sponsored by DebugBear. The opinions expressed in this article are the sponsor’s own.
From a user’s perspective, a slow website can be incredibly frustrating, creating a poor experience. But the impact of sluggish load times goes deeper than just user frustration.
Poor page performance affects search rankings, overall site engagement, E-E-A-T, and conversion rates that results in abandoned sessions, lost sales, and damaged trust.
Even if Google’s Core Web Vitals (CWV) Report is all green.
Sure, Chrome UX (CrUX) and Google’s CWV reports can indicate there’s an issue, but that’s it. They don’t provide you with enough details to identify, troubleshoot, and fix the issue.
And fixing these issues are vital to your digital success.
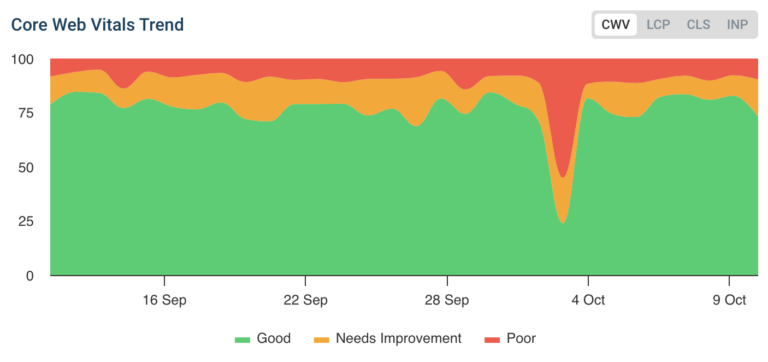 Image from DebugBear, October 2024
This article explores why slow websites are bad for user experience (UX), the challenges that cause them, and how advanced page performance tools can help fix these issues in ways that basic tools can’t.
UX, Brand Perception & Beyond
While often at the bottom of a technical SEO checklist, site speed is critical for UX. Sites that load in once second convert 2.5 to 3 times more than sites that require five seconds to load.
And yet, today, an estimated 14% of B2C ecommerce websites require five seconds or more to load.
These numbers become even more pronounced for mobile users, for whom pages load 70.9% slower. Mobile users have 31% fewer pageviews and an average of 4.8% higher bounce rate per session.
According to a recent Google study, 53% of mobile users will abandon a page if it takes more than three seconds to load.
Poor page experience can negatively other aspects of your site, too:
- Search Rankings – Google includes page experience, of which CWV and page performance is a factor, when ranking web pages.
- User Trust – Poor performing pages fail to meet a potential customer’s expectations. They are often perceived by users as the brand inconveniencing them, introducing stress, negative emotions, and a loss of a sense of control to the buying process. Slower pages can also cause users to forget information gained from previous pages, reducing the effectiveness of advertising, copy, and branding campaigns between clicks.
- User Retention – Site visitors who experience slow load times may never return, reducing retention rates and customer loyalty.
Why Basic Page Performance Tools Don’t Fully Solve The Problem
Tools like Google PageSpeed Insights or Lighthouse give valuable insights into how your website performs, but they can often be limited. They tell you that there’s an issue but often fall short of explaining what caused it or how to fix it.
Google’s Chrome User Experience Report (CrUX) and Core Web Vitals have become essential in tracking website performance and user experience.
These metrics—Largest Contentful Paint (LCP), First Input Delay (FID), and Cumulative Layout Shift (CLS)—offer valuable insights into how users perceive a website’s speed and stability.
However, CrUX and Core Web Vitals only tell part of the story. They indicate that a problem exists but don’t show the root cause or offer an immediate path for improvement.
For instance, your LCP might be poor, but without deeper page speed analysis, you wouldn’t know whether it’s due to an unoptimized image, a slow server response, or third-party scripts.
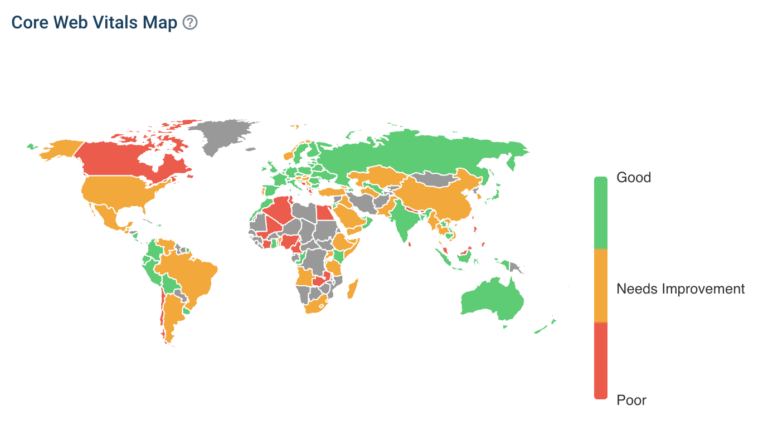 Image from DebugBear, October 2024
Here’s where DebugBear stands out. DebugBear digs deeper, offering more granular data and unique features that basic tools don’t provide.
Continuous Monitoring and Historical Data – Many speed testing tools only offer snapshots of performance data. DebugBear, on the other hand, allows for continuous monitoring over time, providing an ongoing view of your site’s performance. This is crucial for detecting issues that crop up unexpectedly or tracking the effectiveness of your optimizations.
Granular Breakdown by Device, Location, and Browser – Basic tools often provide aggregated data, which hides the differences between user experiences across various devices, countries, and network conditions. DebugBear lets you drill down to see how performance varies, allowing you to optimize for specific user segments.
Pinpointing Content Elements Causing Delays – One of DebugBear’s standout features is its ability to show exactly which content elements—images, scripts, or third-party code—are slowing down your website. Rather than wasting hours digging through code and experimenting with trial and error, DebugBear highlights the specific elements causing delays, allowing for targeted, efficient fixes.
Why You Need Continuous Page Speed Testing
One of the biggest pitfalls in web performance optimization is relying on single-point speed tests.
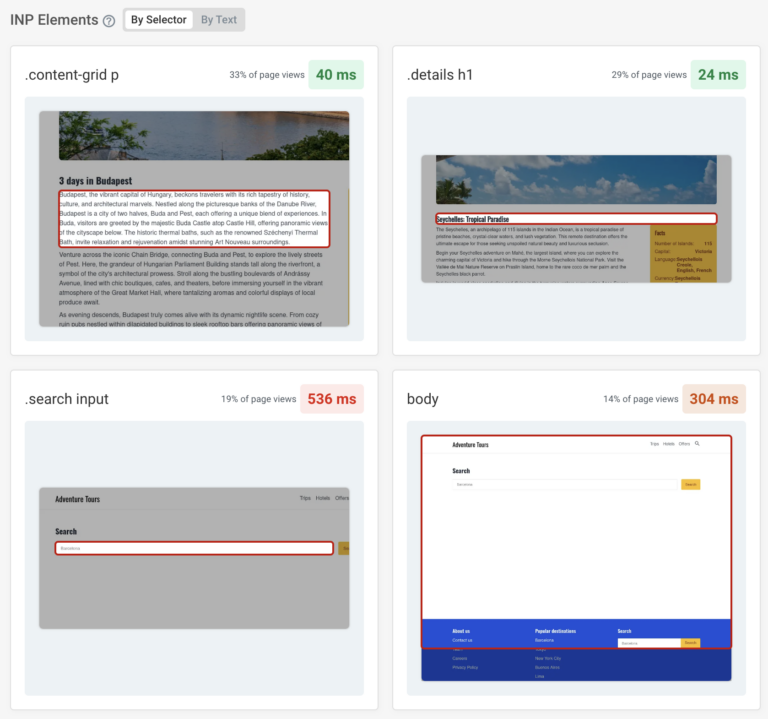 Image from DebugBear, October 2024
Running a one-time test may give you a snapshot of performance at that moment, but it doesn’t account for fluctuations caused by different factors, such as traffic spikes, varying user devices, or changes to site content.
Without continuous testing, you risk spending hours (or even days) trying to identify the root cause of performance issues.
DebugBear solves this problem by continuously tracking page speed across different devices and geographies, offering detailed reports that can be easily shared with team members or stakeholders.
If a performance dip occurs, DebugBear provides the data necessary to quickly identify and rectify the issue, saving you from the endless trial-and-error process of manual debugging.
Without tools like DebugBear, you’re left with only a high-level view of your website’s performance.
This means hours of trying to guess the underlying issues based on broad metrics, with no real insight into what’s dragging a site down.
Different Users Experience Performance Differently
Not all users experience your website’s performance in the same way.
Device type, geographic location, and network speed can significantly affect load times and interaction delays.
For example, a user on a fast fiberoptic connection in the U.S. may have a completely different experience than someone on a slower mobile network in India.
This variance in user experience can be hidden in aggregate data, leading you to believe your site is performing well when a significant portion of your audience is actually struggling with slow speeds.
Here’s why breaking down performance data by device, country, and browser matters:
- Device-Specific Optimizations – Some elements, like large images or animations, may perform well on desktop but drag down speeds on mobile.
- Geographic Performance Variations – International users may experience slower speeds due to server location or network conditions. DebugBear can highlight these differences and help you optimize your content delivery network (CDN) strategy.
- Browser Differences – Different browsers may handle elements like JavaScript and CSS in different ways, impacting performance. DebugBear’s breakdown by browser ensures you’re not overlooking these subtleties.
Without this granular insight, you risk alienating segments of your audience and overlooking key areas for optimization.
And troubleshooting these issues becomes and expensive nightmare.
Just ask SiteCare.
WordPress web development and optimization service provider SiteCare uses DebugBear to quickly troubleshoot a full range of WordPress sites, solve performance issues faster, and monitor them for changes, providing high quality service to its clients, saving thousands of hours and dollars every year.
DebugBear offers these breakdowns, providing a clear view of how your website performs for all users, not just a select few.
Real User Monitoring: The Key To Accurate Performance Insights
In addition to synthetic testing (which mimics user interactions), real user monitoring (RUM) is another powerful feature technical SEOs and marketing teams will find valuable.
While synthetic tests offer valuable controlled insights, they don’t always reflect the real-world experiences of your users.
RUM captures data from actual users as they interact with your site, providing real-time, accurate insights into what’s working and what isn’t.
For instance, real user monitoring can help you:
- Identify performance issues unique to specific user segments.
- Detect trends that may not be visible in synthetic tests, such as network issues or slow third-party scripts.
- Measure the actual experience users are having on your website, not just the theoretical one.
Without real user monitoring, you might miss critical issues that only surface under specific conditions, like a heavy user load or slow mobile networks.
If you’re not using continuous page speed testing and in-depth reports, you’re flying blind.
You may see an overall decline in performance without understanding why, or you could miss opportunities for optimization that only reveal themselves under specific conditions.
The result?
Wasted time, frustrated users, lost conversions, and a website that doesn’t perform up to its potential.
DebugBear solves this by offering both continuous monitoring and granular breakdowns, making it easier to troubleshoot issues quickly and accurately.
With detailed reports, you’ll know exactly what to fix and where to focus your optimization efforts, significantly cutting down on the time spent searching for problems.
Image Credits
Featured Image: Image by Shutterstock. Used with permission.
In-Post Images: Images by DebugBear. Used with permission.