
Google has defined a set of metrics site owners should focus on when optimizing for page experience. Core Web Vitals metrics are part of Google’s page experience factors that all websites should strive to meet.
Users’ expectations for web experiences can vary according to site and context, but some remain consistent regardless of where they are on the web.
Specifically, Google identifies the core user experience needs such as loading speed, interactivity, and visual stability.
What Are Core Web Vitals Scores?
Google recommends site owners have CWV metrics under the ‘good’ threshold specified below:
| Metric name | Good | Poor |
| Largest Contentful Paint (LCP) | ≤2500ms | >4000ms |
| Interaction to Next Paint (INP) | ≤2000ms | >500mx |
| Cumulative Layout Shift (CLS) | ≤1 | >0.25 |
Anything in between good and poor is considered as moderate, which should be improved.
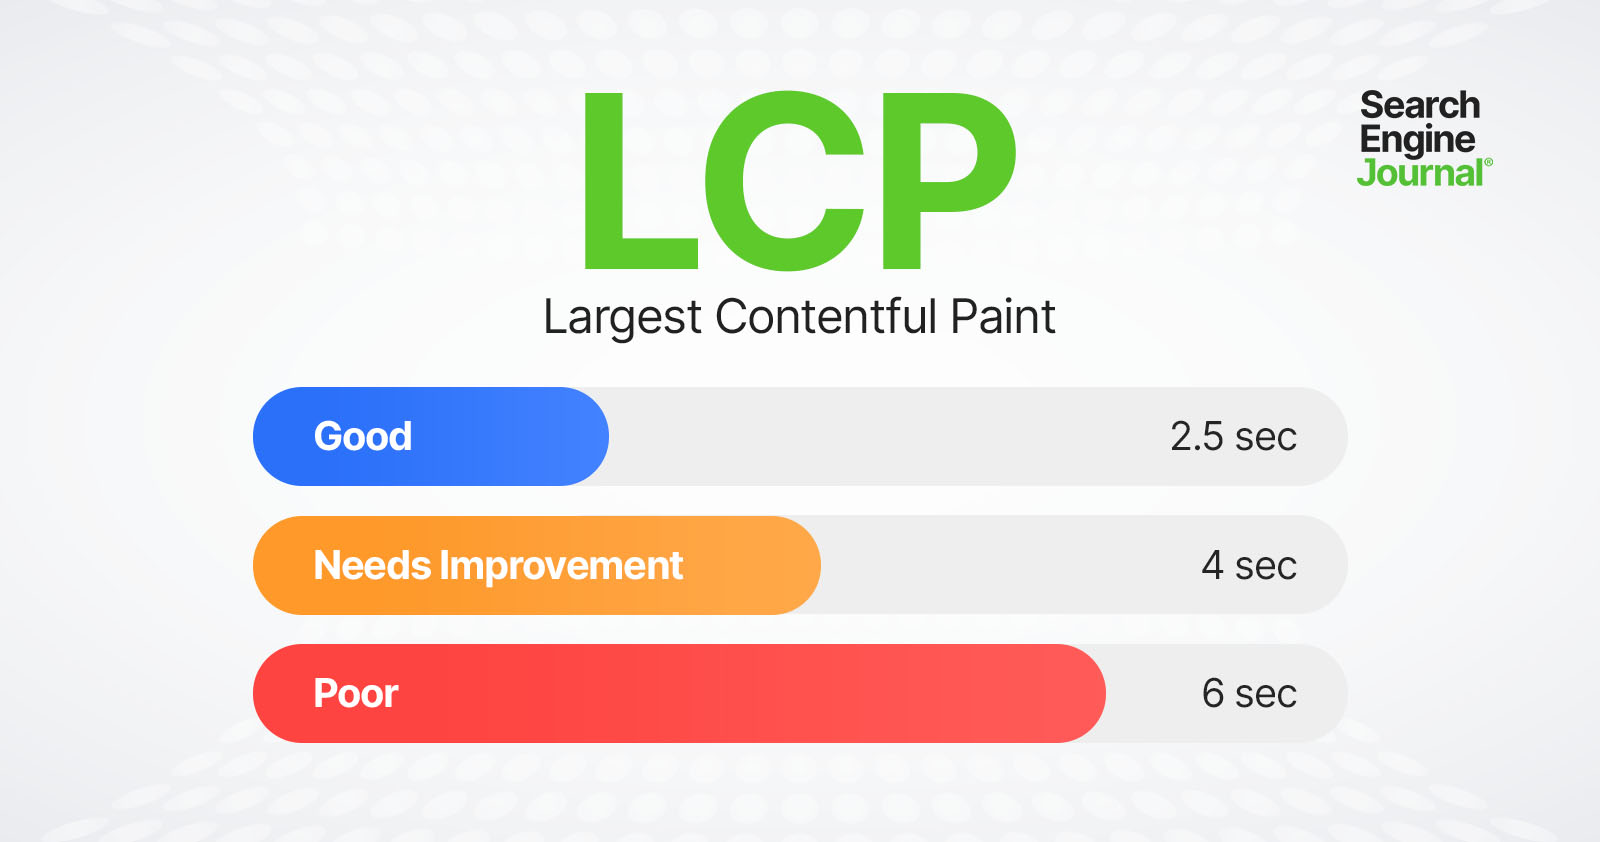 Diagram showing three Core Web Vitals performance metrics
Google explains why these three metrics, in particular, are so important:
“All of these metrics capture important user-centric outcomes, are field measurable, and have supporting lab diagnostic metric equivalents and tooling.
For example, while Largest Contentful Paint is the topline loading metric, it is also highly dependent on First Contentful Paint (FCP) and Time to First Byte (TTFB), which remain critical to monitor and improve.”
How Google Measures Core Web Vitals
Google CrUX report uses Chrome data when users browse websites to gather real-world user data from their devices. At least 75% of pageviews to the site should have ‘good’ scores for the website to meet CWV thresholds.
Please note it uses 75% of pageviews of the entire site, which means pages with poor CWV and less traffic will not impact the overall website score.
This is why you may find that websites with a ‘good’ score have pages with terrible CWVs and vice versa.
This method of measuring ensures that a low number of percentage visits due to slow network conditions doesn’t take down the entire website’s ‘good’ score.
Here’s how those metrics can be measured.
How To Measure Core Web Vitals
Google incorporates Core Web Vitals measurement capabilities into many of its existing tools.
Core Web Vitals can be measured using these free tools:
Let’s dive into how to use each of these free SEO tools to measure Core Web Vitals.
PageSpeed Insights
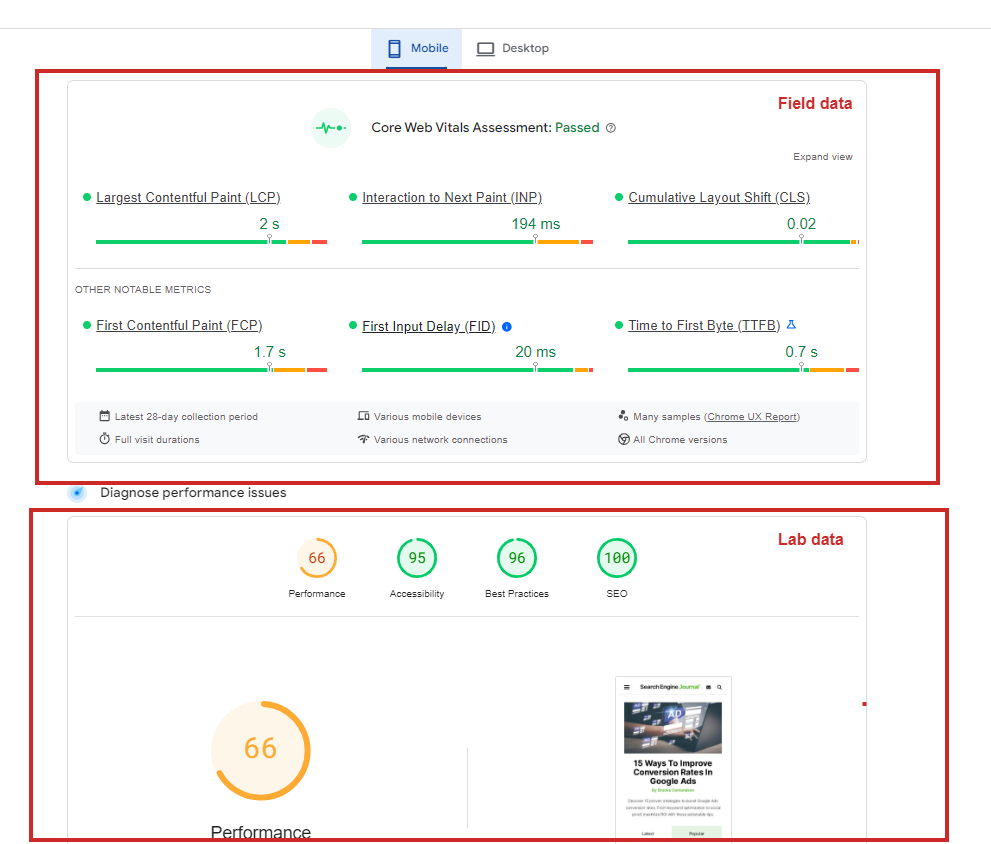
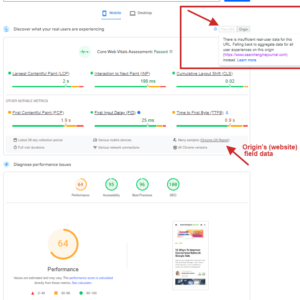
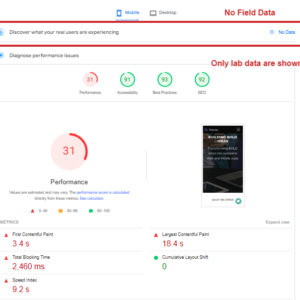
PageSpeed Insights allows you to measure Core Web Vitals with both lab and field data included in the reports.
The lab section of the report provides data gathered from real users’ devices in all geos and different network conditions, whereas the field section shows data from simulated devices using just one device.
 Pagespeed insights report. Field vs. Lab data
If your pages have few visits or are new, there might be insufficient historical data for field data to show a report. In that case, the average field score for the entire website will be used as a fallback if available; otherwise, it will show no data.
Once you run reports you will have a list of recommendations on how to improve your scores underneath. You can read our guide on the PageSpeed Insights report to learn how to use it.
Web Vitals Extension
Using the PageSpeed Insights tool is always a great way to debug and audit performance, but it is often not convenient. You have to open a new tab in your browser and navigate away from the page, which is distracting.
Fortunately, there is an extension available to install from the Chrome Web Store that measures Core Web Vitals metrics in real-time during your browsing and also loads field data if available.
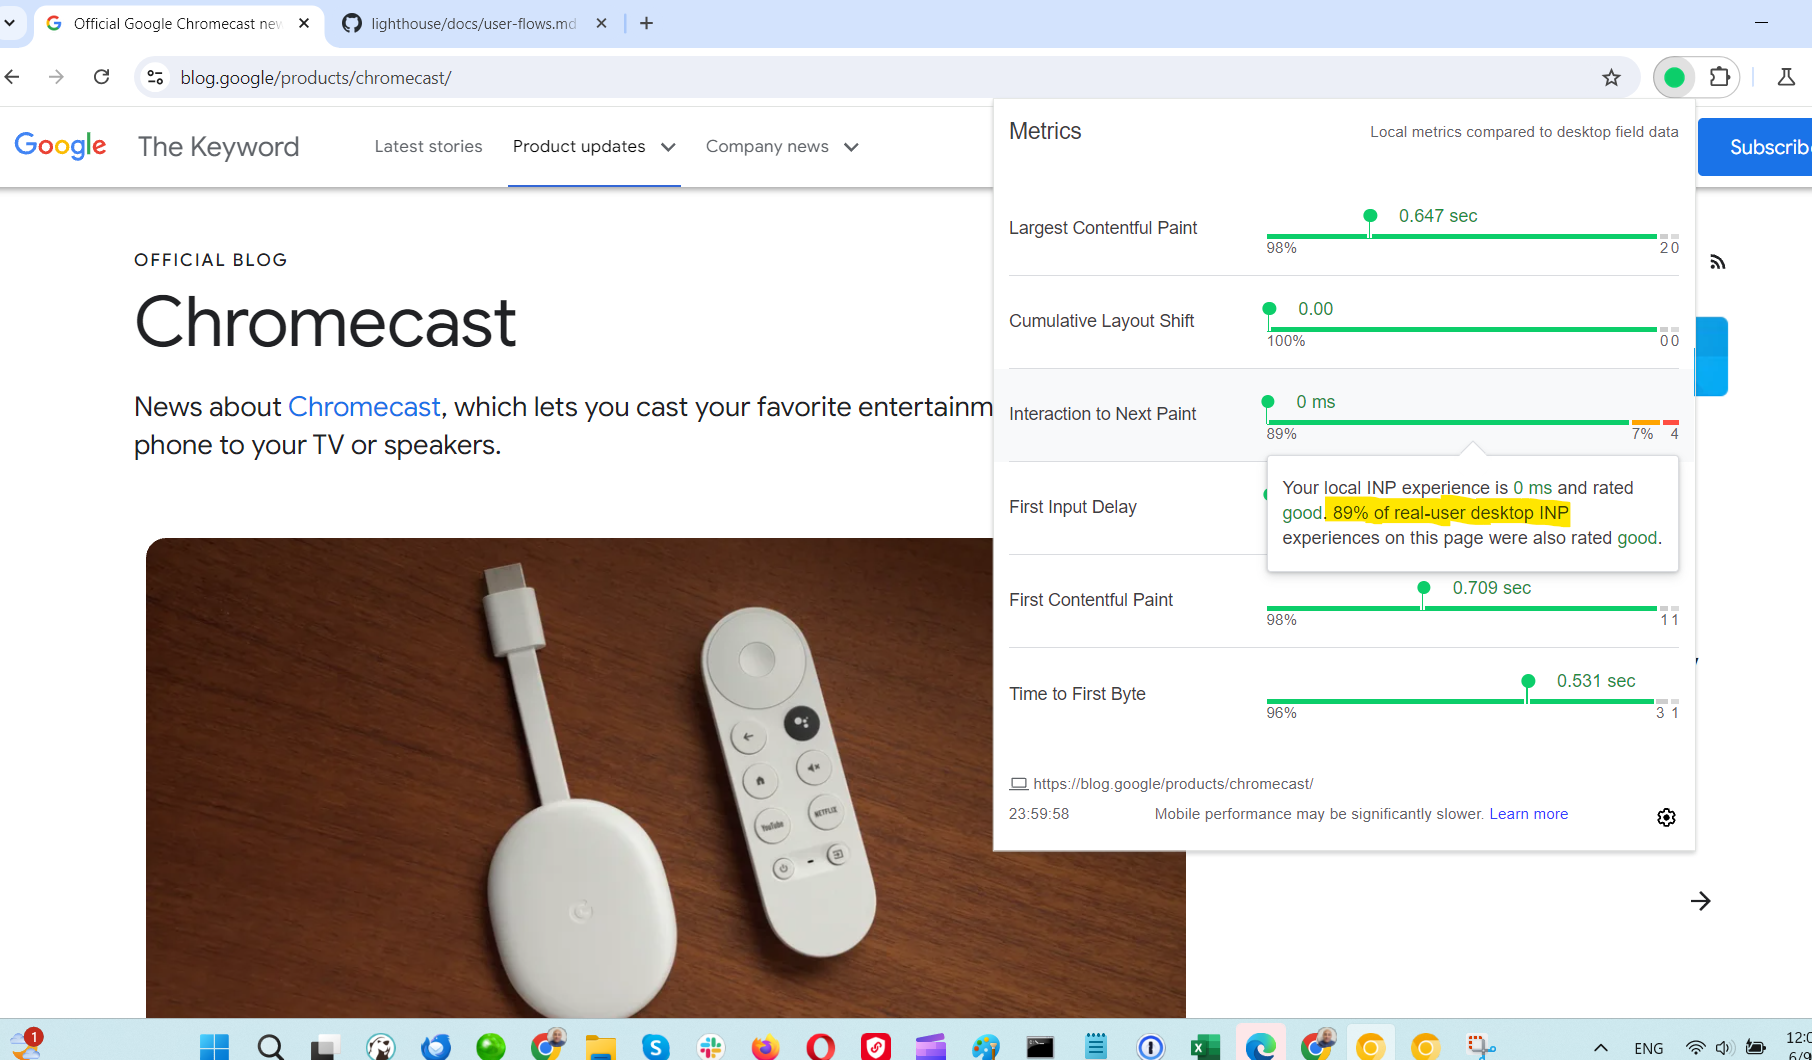 Core Web Vitals scores
Besides this standard UI, this addon also offers more granular debugging opportunities via the browser DevTools ‘console’ tab. Here is a quick video guide on how to do that.
Debugging the Interaction Next Paint metric is quite challenging as it may degrade at any point during the user interaction journey. In PageSpeed Insights, you get only an average value across all interactions, not which interaction on the specific element on the page was slow.
By using this extension, you can interact with the page and identify elements that degrade the INP metric by checking the console logs. For example, you can click on buttons and check the console to see how long the interaction took.
As soon as you identify which element is slow to respond, you can check your JavaScript code to see if any scripts are blocking the interaction.
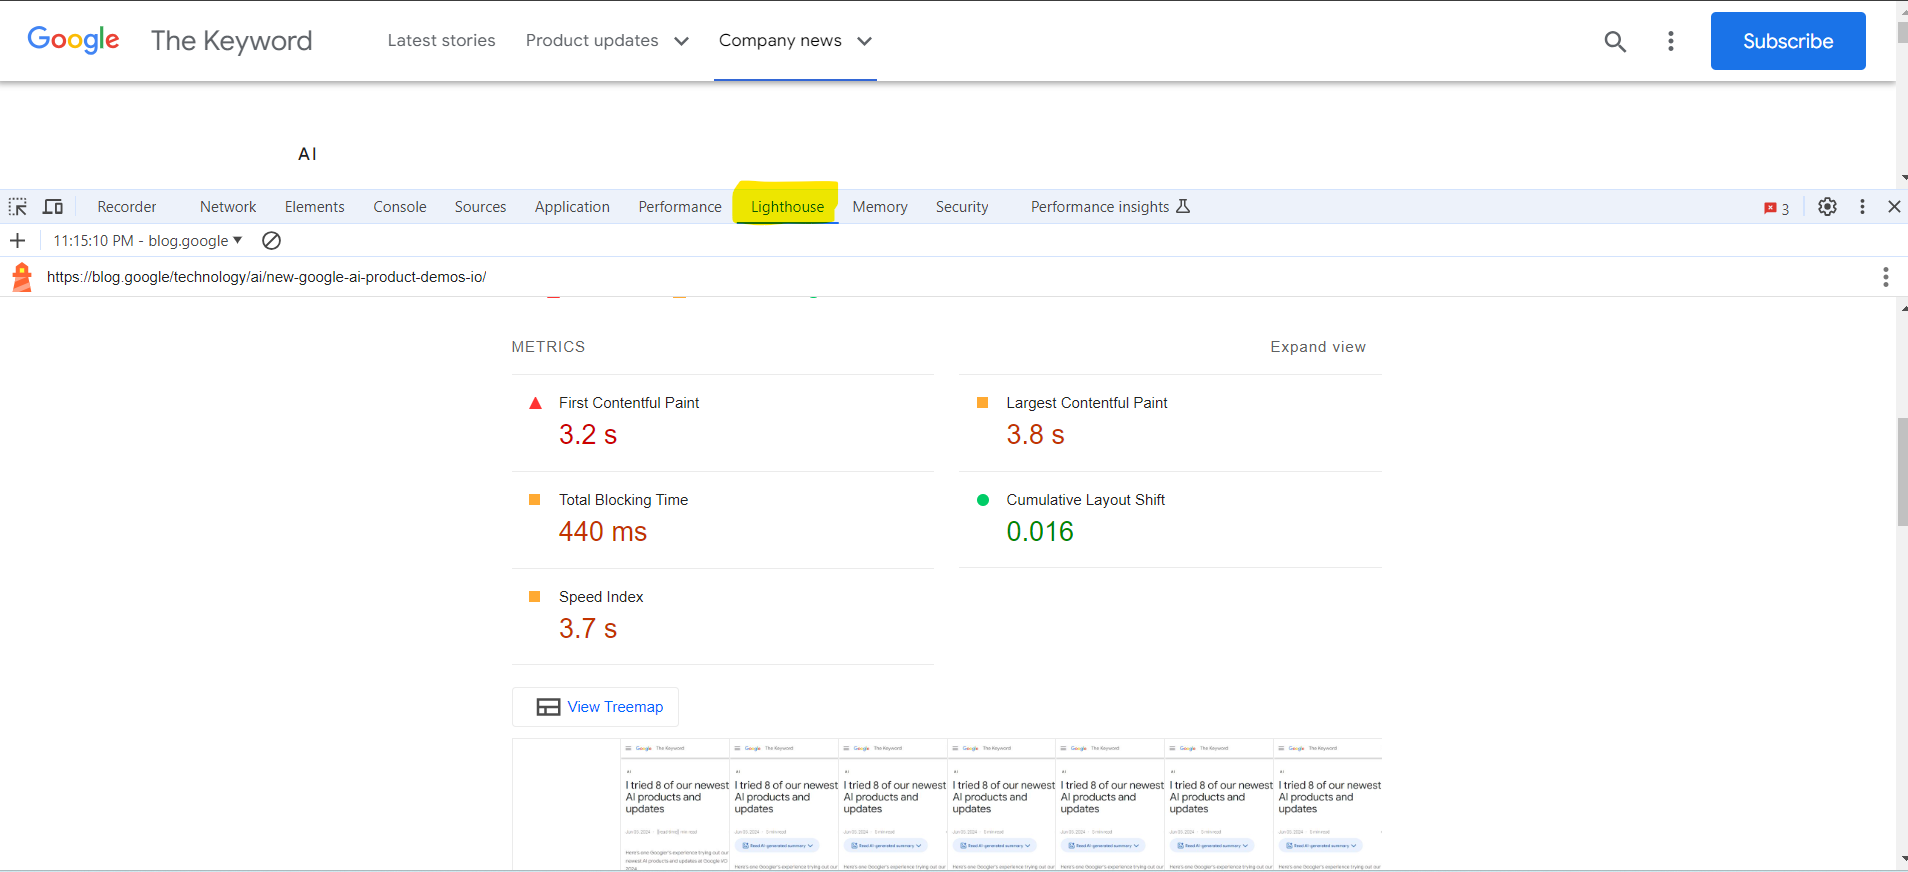
Lighthouse
Lighthouse is an open-source tool you can use to audit your webpage’s performance, which is also available in Chrome’s DevTools.
All of the reports that Lighthouse powers are updated to reflect the latest version.
 Example lighthouse report in chrome browser DevTools
One caveat to be aware of is that when running Lighthouse in your browser, it also loads many resources from your Chrome extensions, which can affect your metrics in the Lighthouse report.
 The message indicated issues with the Lighthouse run and specifically mentioned that Chrome extensions negatively impacted the page’s load performance.
That’s why I suggest using Chrome Canary for debugging as a good practice. Chrome Canary has an isolated installation from your regular Chrome browser where you can access experimental features. This allows you to test your website with features that will be included in future Chrome releases.
I ran a quick experiment to see how drastically Lighthouse page speed scores can vary in the Canary clean installation vs. your browser with add-ons enabled.
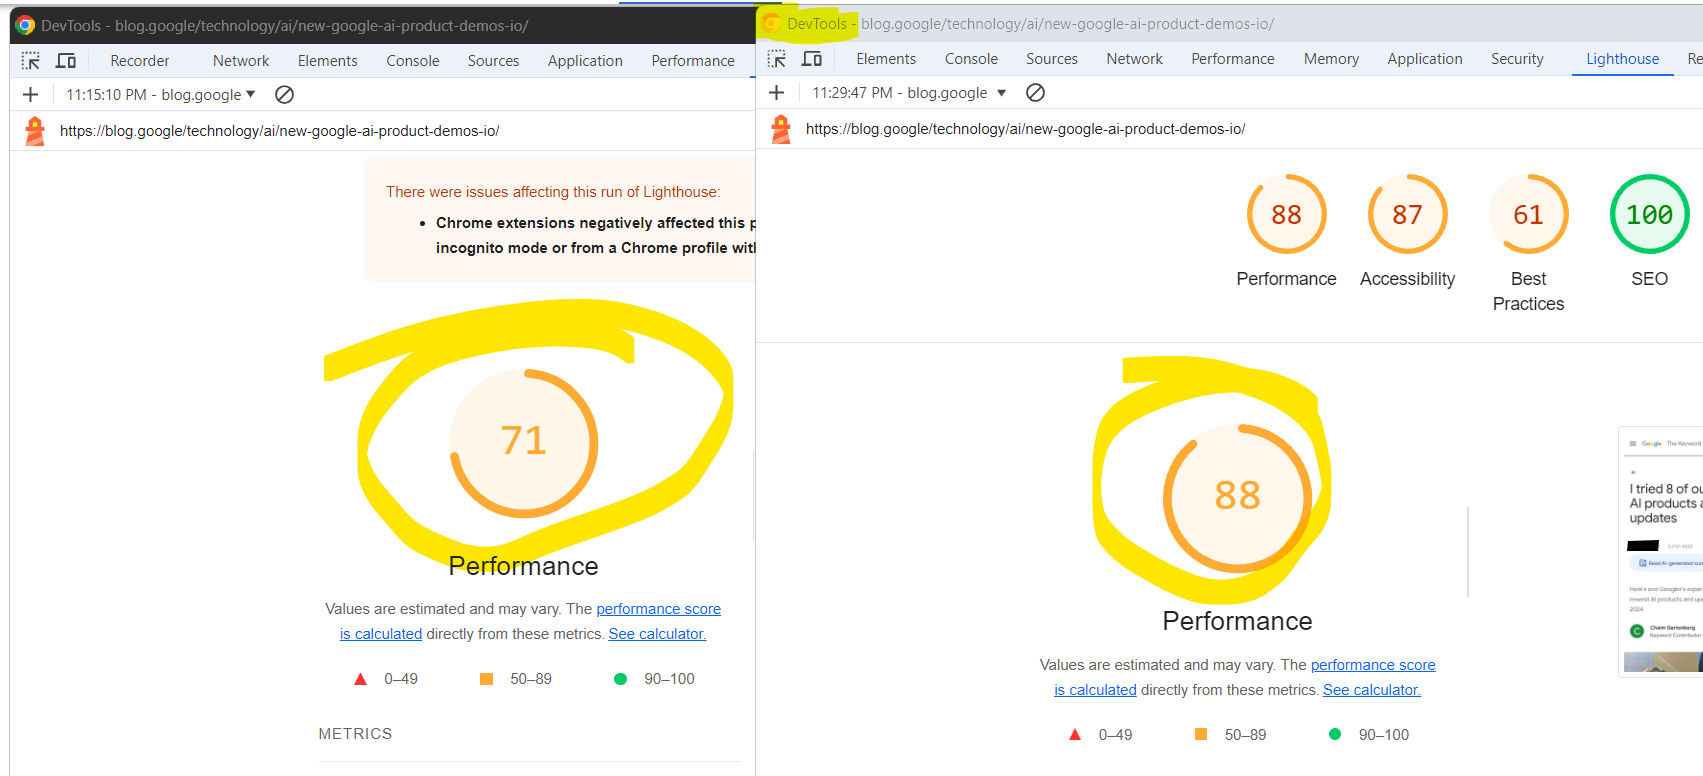 Two screenshots of Google Chrome DevTools’ Lighthouse audit results. Left: Chrome stable version with add-ons and right: Canary without add-ons.
One important feature that Lighthouse enables is measuring scores while interacting with the webpage and measuring how certain interactions affect your scores, especially the Interaction to Next Paint (INP) metric.
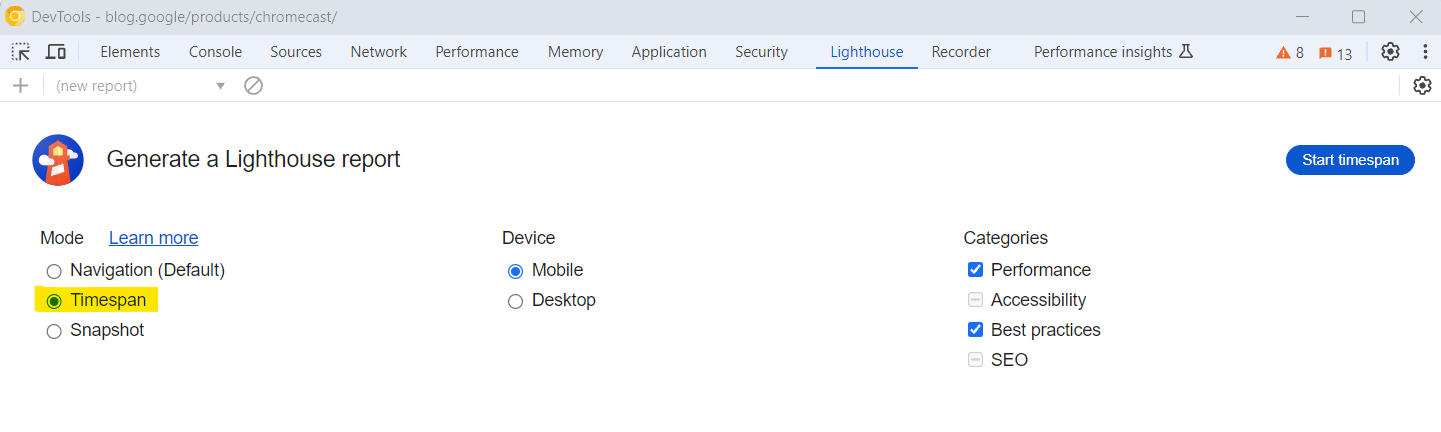 Option timespan in Chrome Lighthouse DevTools
I suggest you dive deep and master how to use Lighthouse by reading our guide written by the two of most experienced technical SEO experts in the world.
CrUX Dashboard
CrUX report is a public dataset of real user experience data on millions of websites. The Chrome UX report measures field versions of all the Core Web Vitals, which means it reports real-world data rather than lab data.
With PageSpeed Insights, Lighthouse, or the Web Vital add-on we have discussed, you now know how to measure individual URL performance. But how do you see the whole picture for a website with thousands of URLs? What percentage of URLs have ‘good’ scores or scores from a few months ago to compare against?
This is where Google’s CrUX free Looker Studio dashboard helps. You can check segments and see your historical data.
To do that, simply copy and paste your domain into the CrUX dashboard launcher.
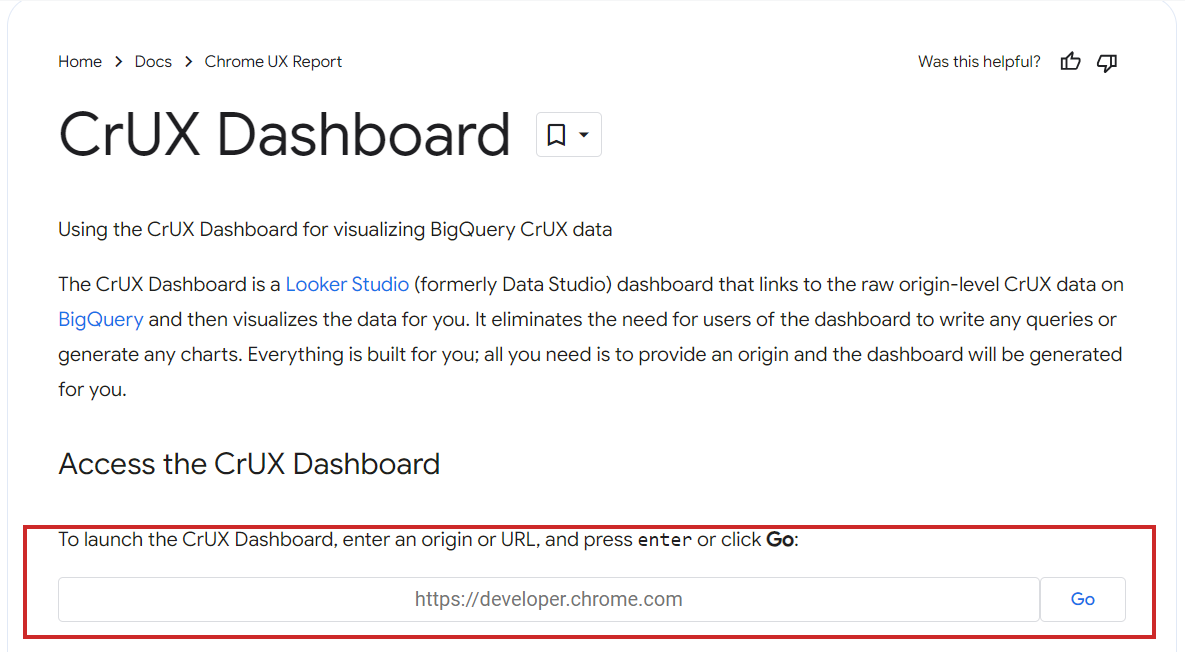 CrUX dashboard launcher
Then, enjoy beautiful reports for free. Here is an example report for Search Engine Journal in case you want to explore a real dashboard.
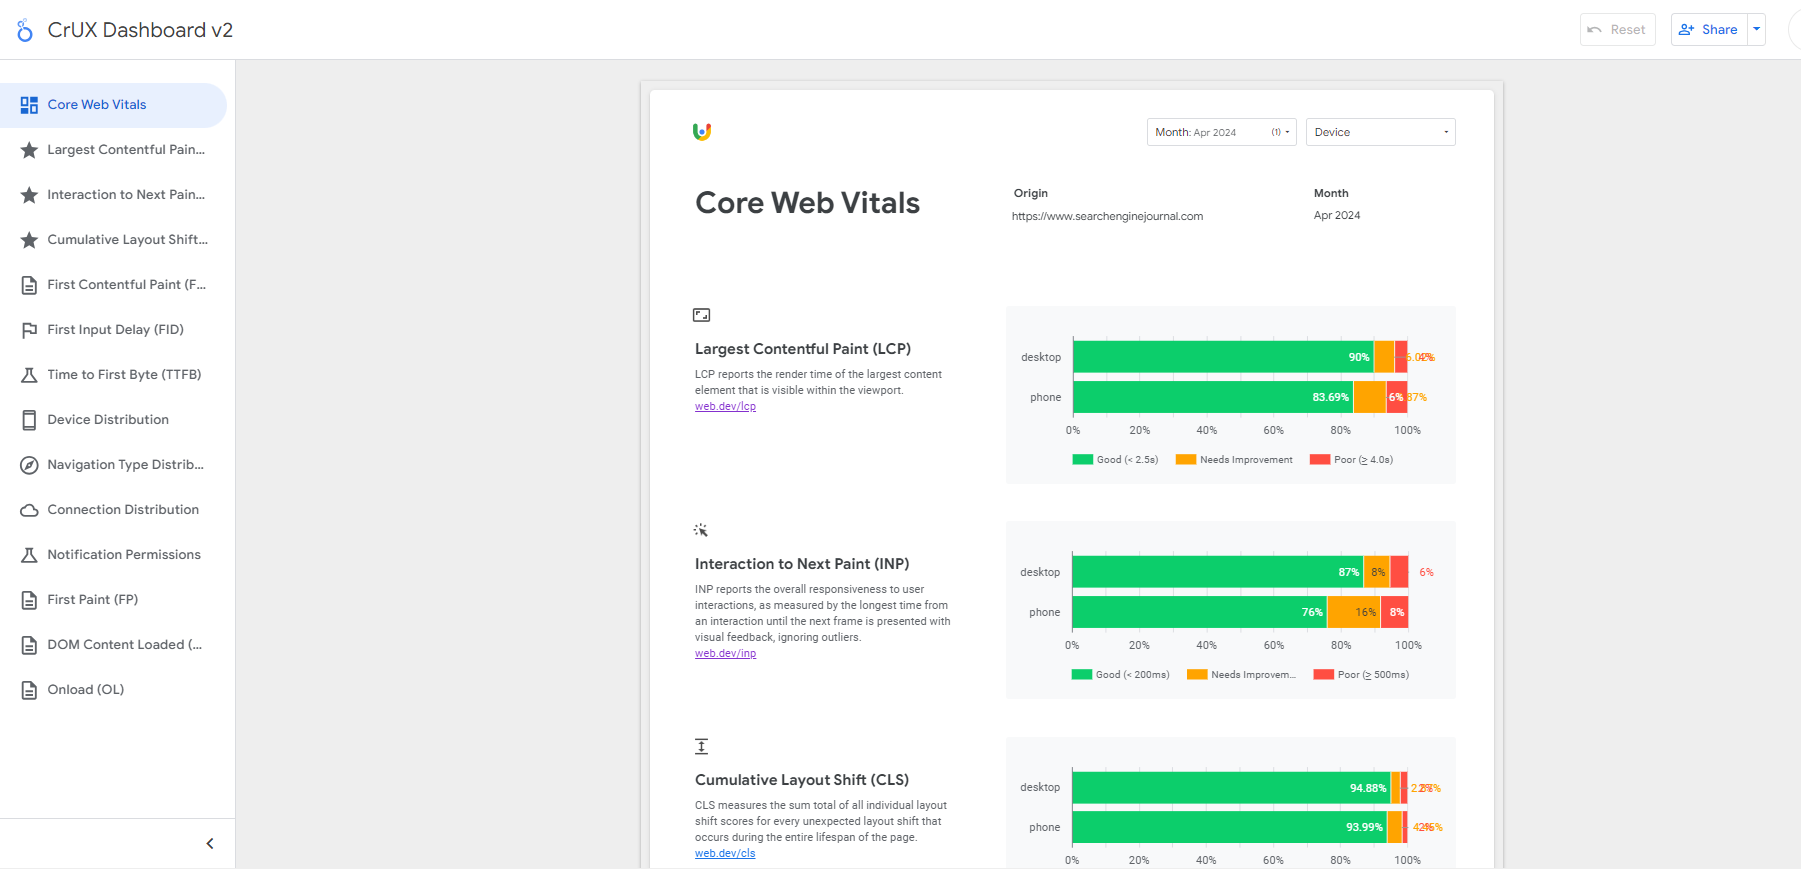 CrUX dashboard example for Search Engine Journal
In this dashboard, you can find much more besides the CWV metrics. If you fall short of CWV ‘good’ scores but lab data shows you are meeting all thresholds, it may be because your visitors have a bad connection.
This is where the connection distribution report is highly valuable: it can help you understand if your scores’ poor performance is due to network issues.
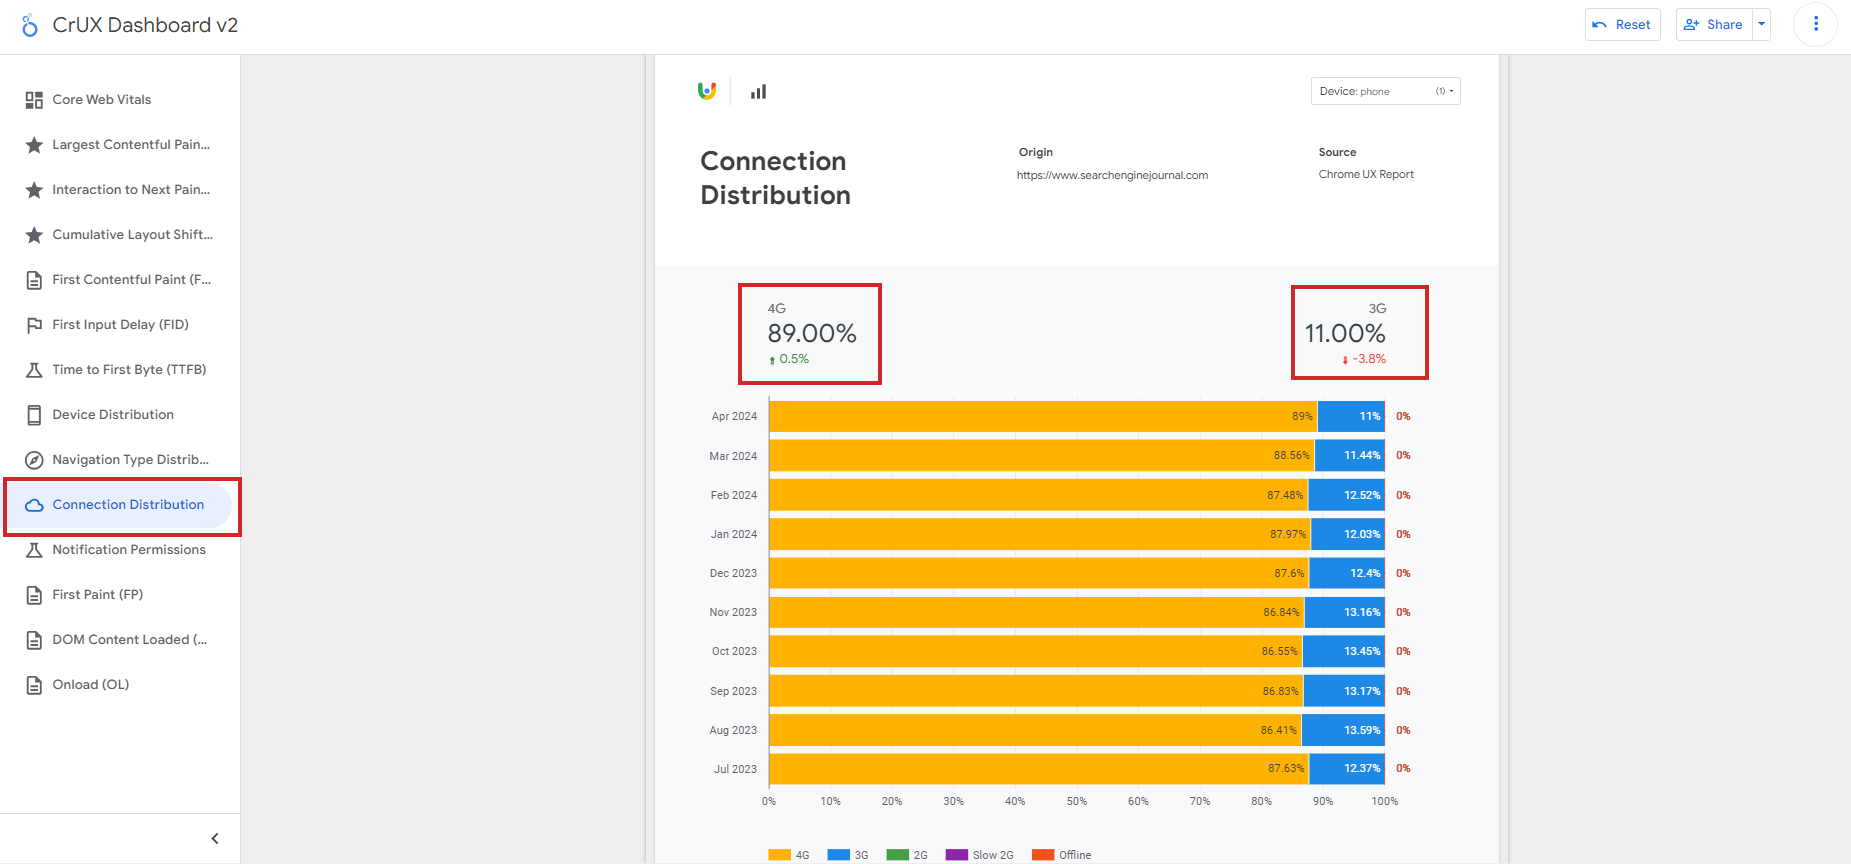 Connection Distribution in CrUX report
Unfortunately, this dashboard doesn’t give you a breakdown of CWV metrics by country, but there is a free tool, treo.sh, which you can use to check performance metrics by geos.
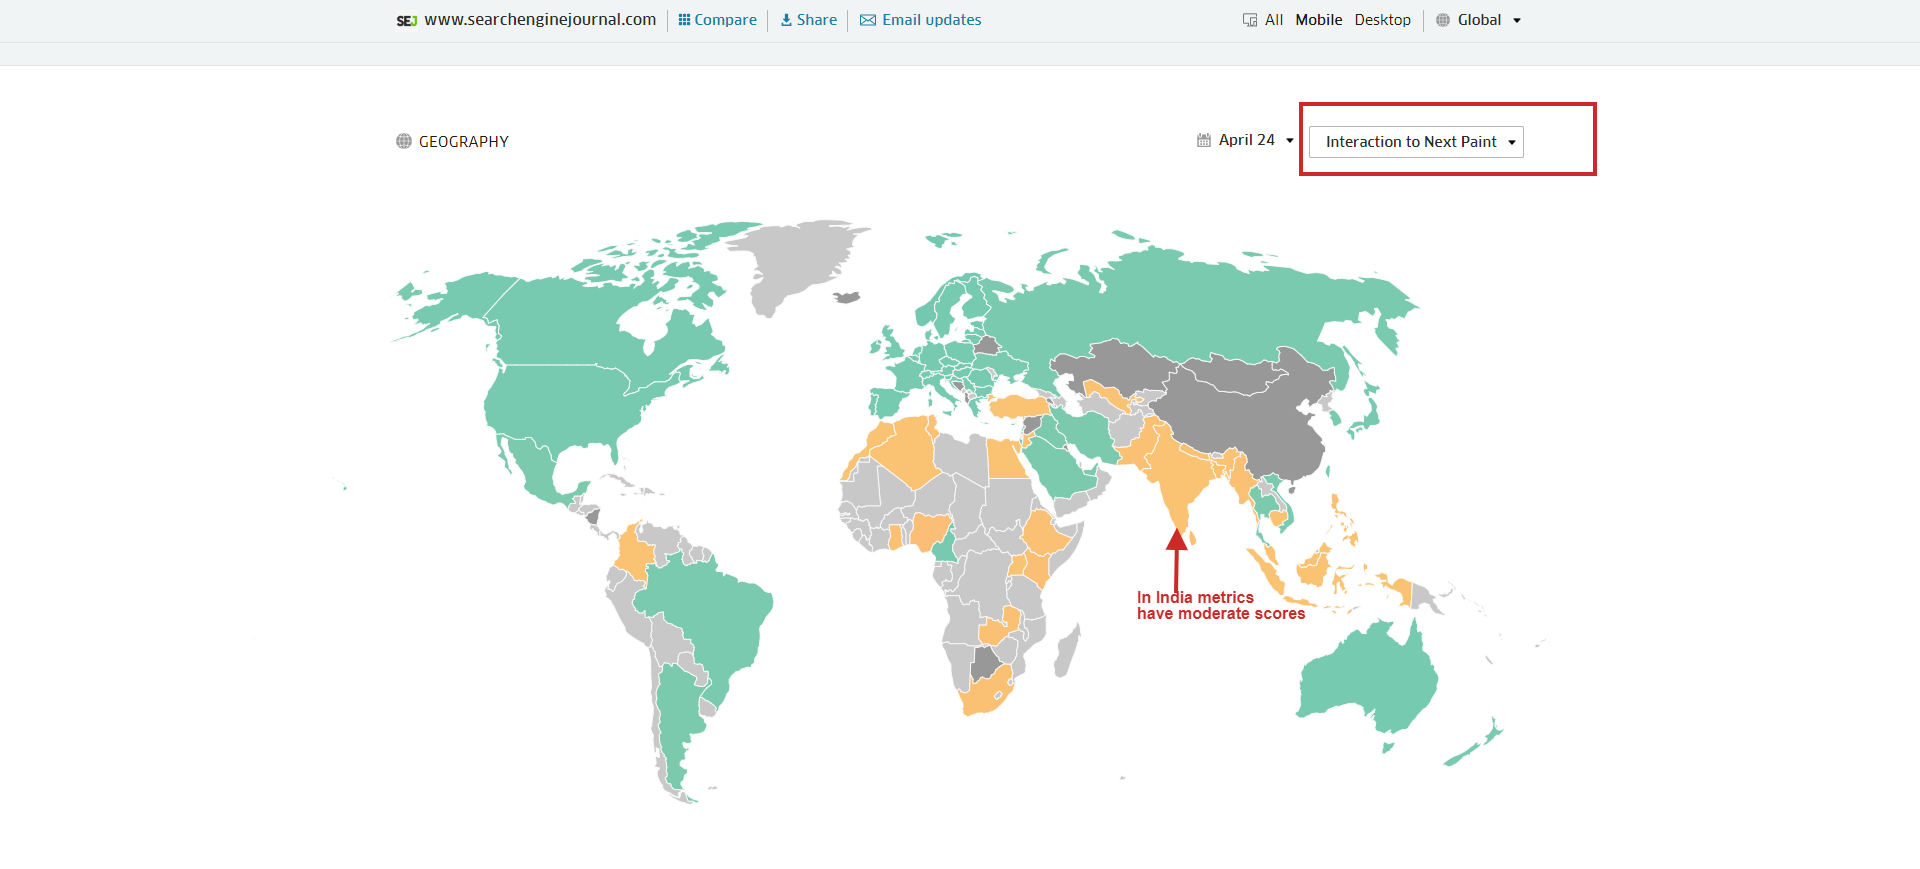 Break down of CWV metrics by geos which helps understand where they fall short of good scores
Search Console
GSC is another tool to see how your overall website CWV metrics.
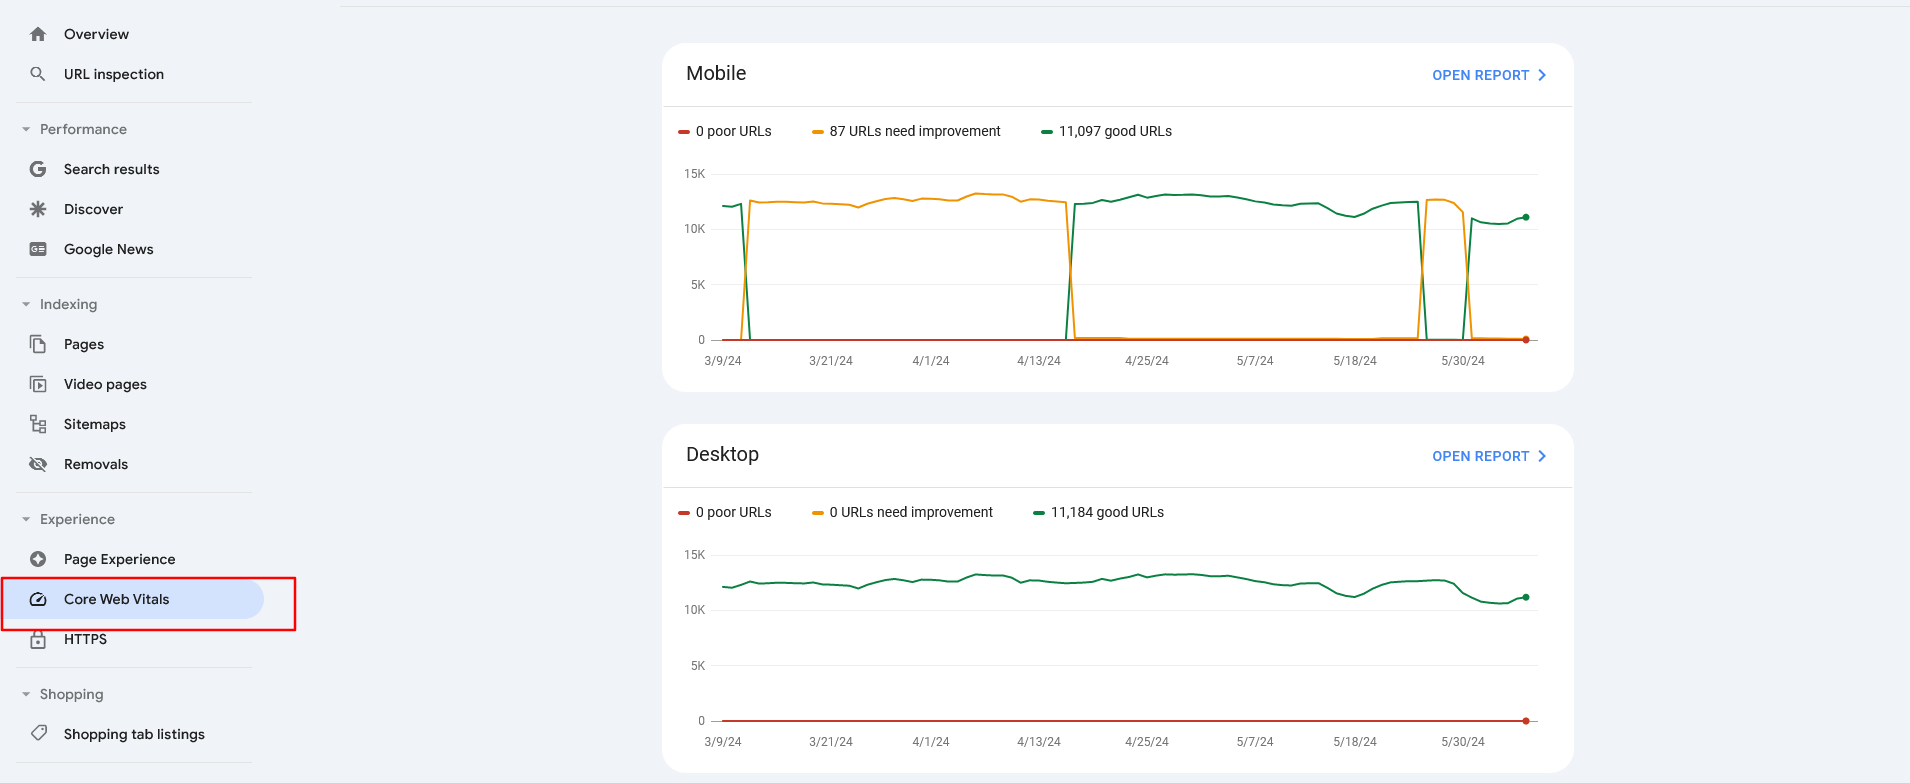 A Google Search Console dashboard displaying “Core Web Vitals”
The report identifies groups of pages that require attention based on real-world data from the Chrome UX report. If you open the report by clicking on the top right corner link, you will see a breakdown of your issues.
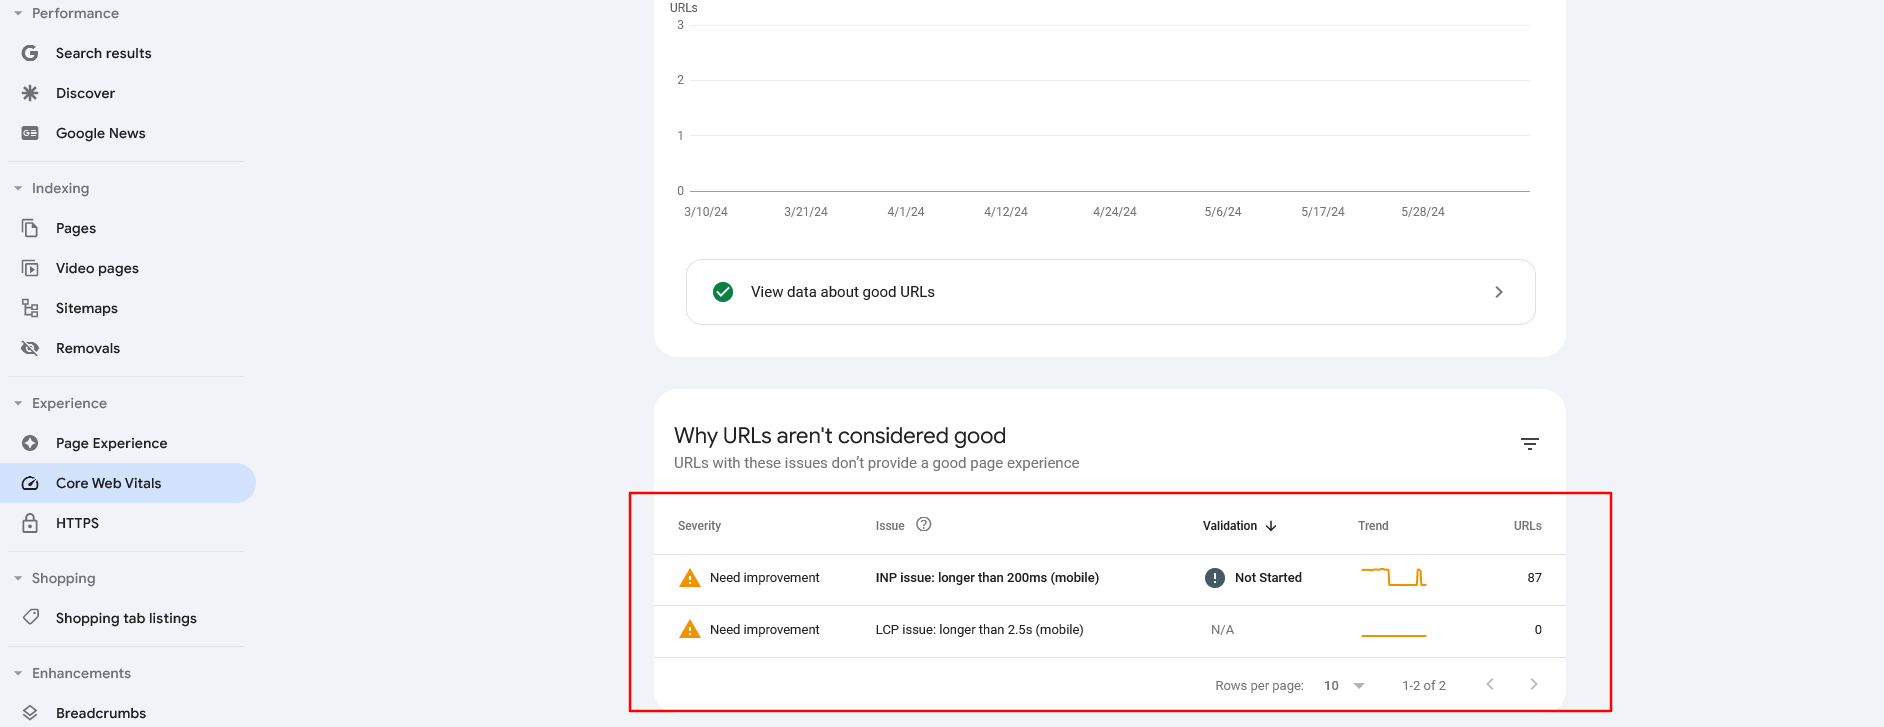 Core Web Vitals report for Mobile in GSC
With this report, be aware that it pulls data from CruX, and URLs will be omitted if they do not have a minimum amount of reporting data, which means you may have pages with poor CWV metrics that are not reported here.
Web-Vitals.JS And GA4
web-vitals.js is an open-source library that accurately measures CWV metrics the same way Chrome or PageSpeed Insights does. The web vitals extension we discussed above actually uses this library for reporting and logging.
However, you can integrate it with Google Analytics 4 to get a detailed performance report at scale on a website with many pages. Below is a code sample for GA4’s gtag integration.
In the code sample, ‘value’ is a built-in parameter, and ‘metric_id’, ‘metric_value’, ‘metric_delta’, ‘metric_rating’, and ‘debug_target’ are optional custom dimensions you may want to include per your needs.
If you want to see these dimensions in GA4’s exploration reports, you need to add them in GA4’s admin of custom definitions. Otherwise, if you decide to send these parameters and not add them via admin you can access raw data via BigQuery only. This provides much more flexibility but requires SQL expertise.
If you decide to include ‘metric_id,’ which, in the case of websites with a lot of traffic, will have an indefinite number of unique values, it may cause cardinality issues in exploration reports.
So, you may want to enable those additional custom parameters for a short period to gather sample data for troubleshooting.
To send CWV metrics data via Google Tag Manager, refer to this guide created by Google’s marketing solution team. As a best practice, you should use GTM integration, and the code above (which is fully functional) demonstrates the fundamental mechanics of CWV data collection and reporting.
Other than what we have discussed, freemium or paid tools such as Debugbear, treo.sh, Oncrawl, Lumar, or Semrush may help you identify your scores on all pages at a scale in real time.
However, I would like to note that from the listed tools, Debugbear and treo.sh are highly specialized in CWV metrics and provide high-granularity insights with advanced segmentations.
What About Other Valuable Metrics?
As important as the Core Web Vitals are, they’re not the only page experience metrics to focus on.
Ensuring your site uses HTTPS, is mobile-friendly, avoids intrusive interstitials, and maintains a clear distinction between the website are crucial parts of page experience ranking factors.
So think of it also from a user-centric point of view, and not only because it is a ranking factor.
For example, from a conversions perspective, if you have a slow ecommerce website, your potential customers may churn, and it will cause revenue losses.
More resources:
Featured Image: BestForBest/Shutterstock