This post was sponsored by DebugBear. The opinions expressed in this article are the sponsor’s own.
Do you want a website that ranks high in Google and converts well?
Making sure your pages load quickly is important to providing a good user experience.
And the three Core Web Vitals metrics that Google introduced have been a ranking signal for several years now.
Not sure how to approach optimizing your Core Web Vitals? This article offers 10 tips on how to approach page speed optimization and what you can do to address some of the most common issues.
1. Use Google Search Console To Check If Page Speed Is Impacting Your SEO
Google Search Console includes a high-level Core Web Vitals report that tells you whether there are pages on your website that need to be optimized for speed. Google collects this page speed data from real Chrome users.
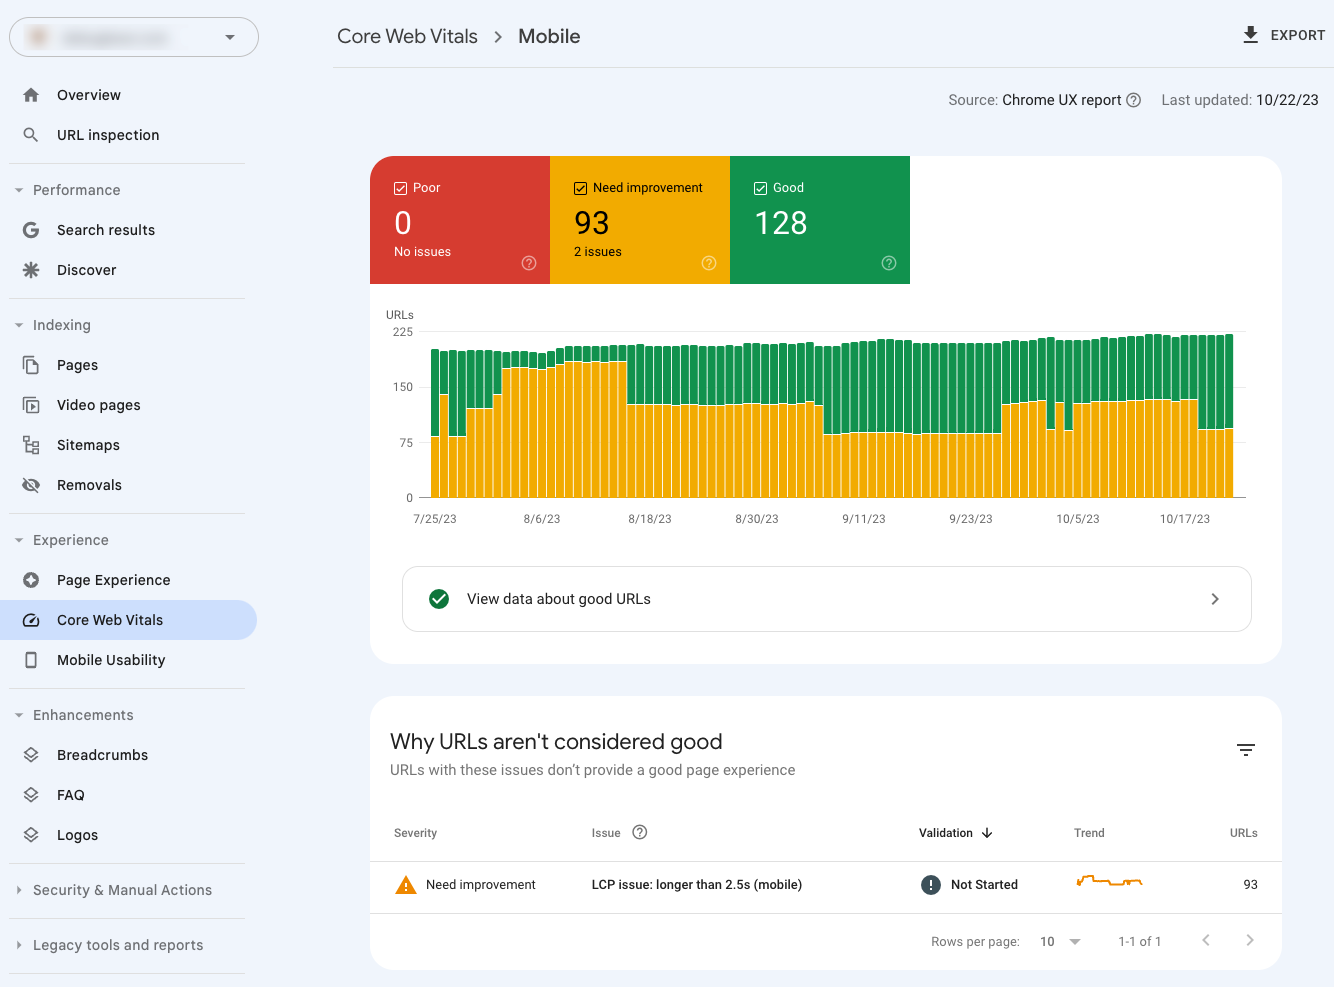 Screenshot of Core Web Vitals in Google Search Console, October 2023
You can click on the individual issues in the “Why URLs aren’t considered good” section and find out what pages are affected by the issue.
Note that Search Console groups similar pages together, so for example the Largest Contentful Paint (LCP) value for the “Example URL” doesn’t necessarily match the overall “Group LCP” value.
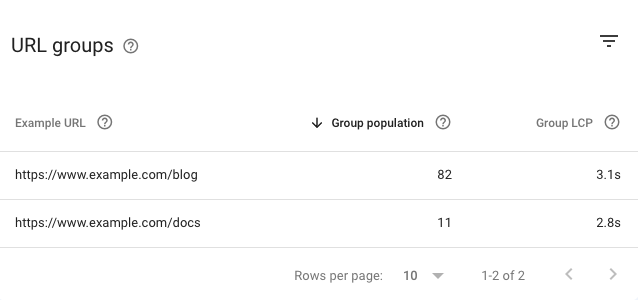 Screenshot of Google Search Console’s URL groups for failed Core Web Vitals assessments, October 2023
2. Run A Free Page Speed Test
Running an online website speed test tells you how fast your website loads, helps you understand your page speed, and provides recommendations on how to improve it. Simply enter your website URL to generate a report.
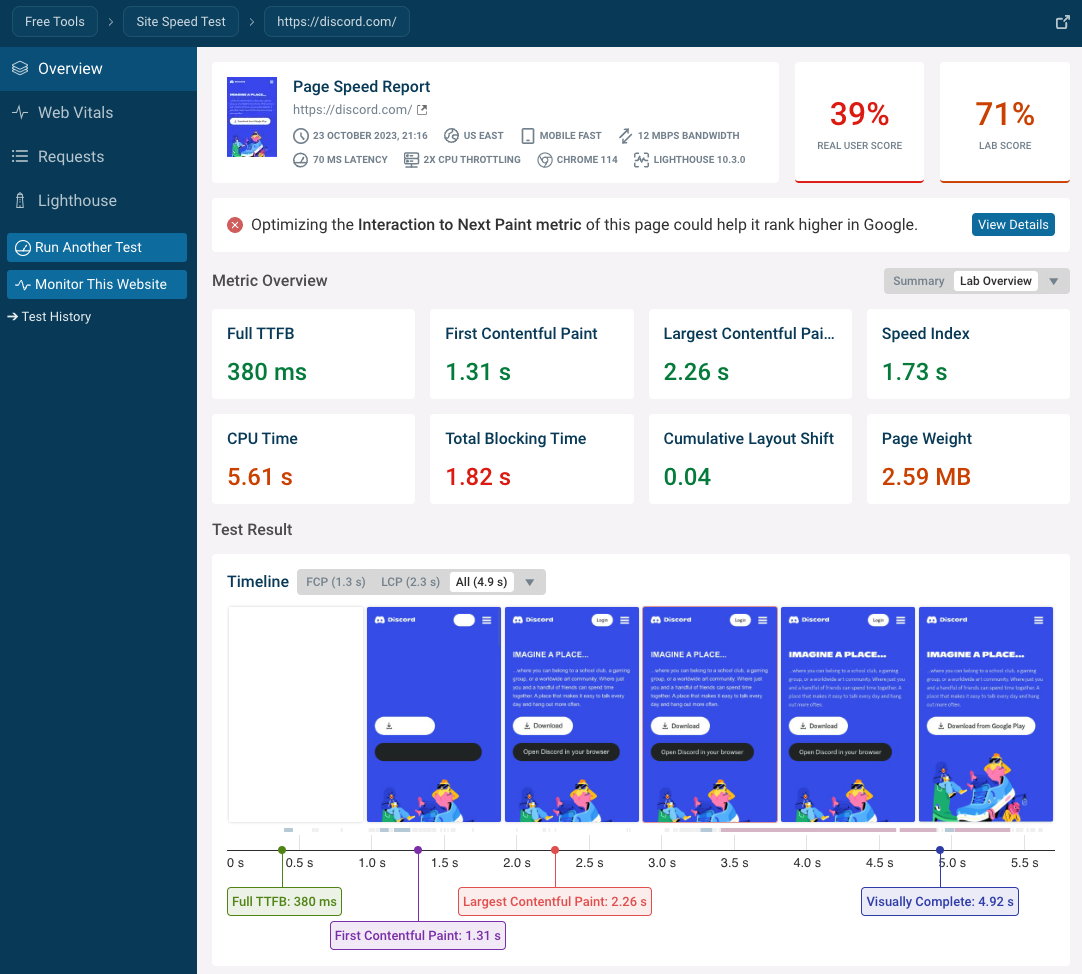 Screenshot of a DebugBear page speed test result, October 2023
You can click on each metric to learn more about what factors are influencing the metric value. For example, many page load milestones can be explained by looking at a request waterfall visualization that shows when different page resources start and finish loading.
The filmstrip view at the top of the waterfall lets you correlate what happens on the network with what your visitors can see.
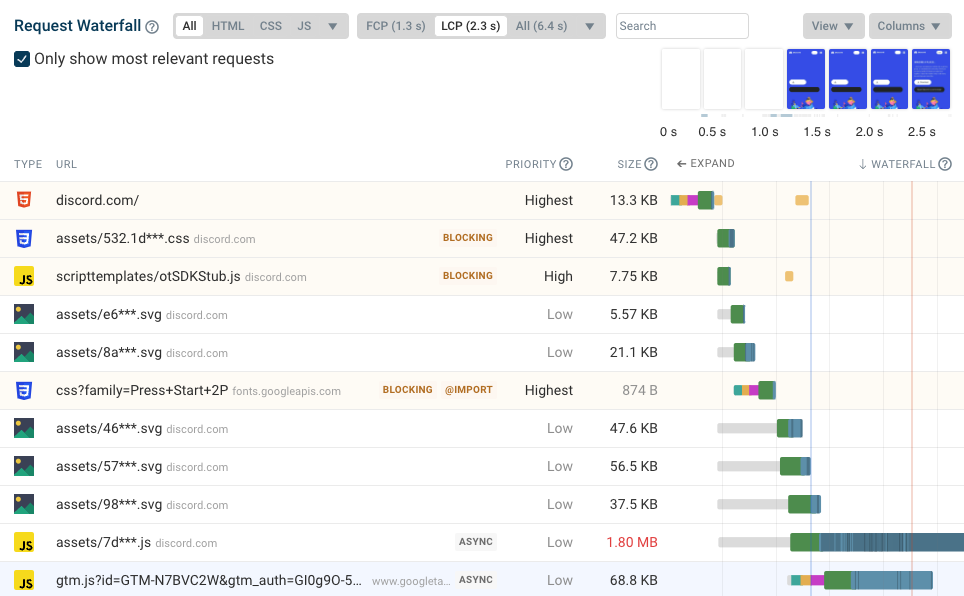 Screenshot of a waterfall visualization showing requests and page load progress, October 2023
You can also see how your website is doing in the real user Chrome User Experience Report (CrUX) data. This is the data that Google uses as a ranking signal.
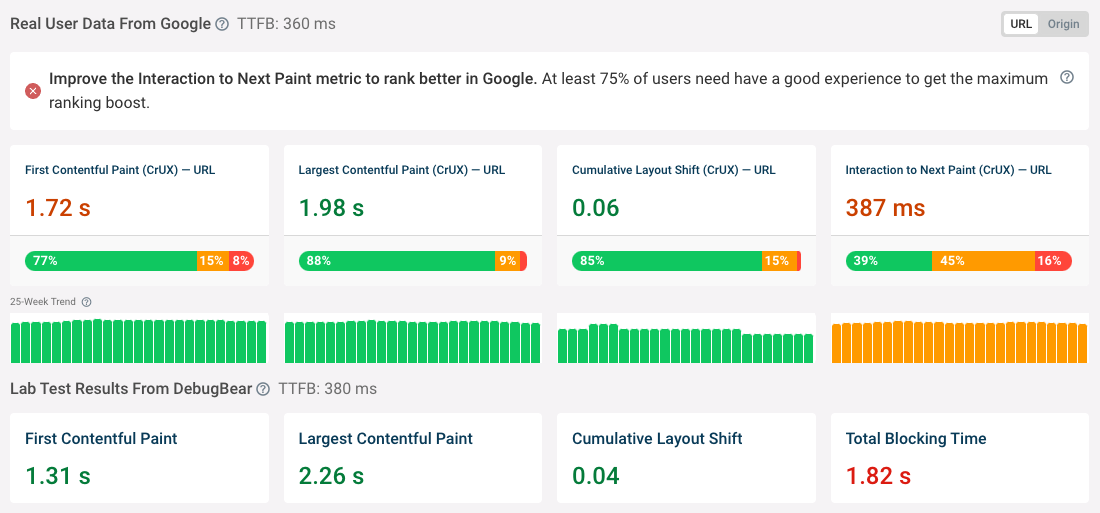 Screenshot of Google web vitals trends and speed test results, October 2023
Finally, you can find page speed recommendations specific to your website at the bottom of the “Overview” tab.
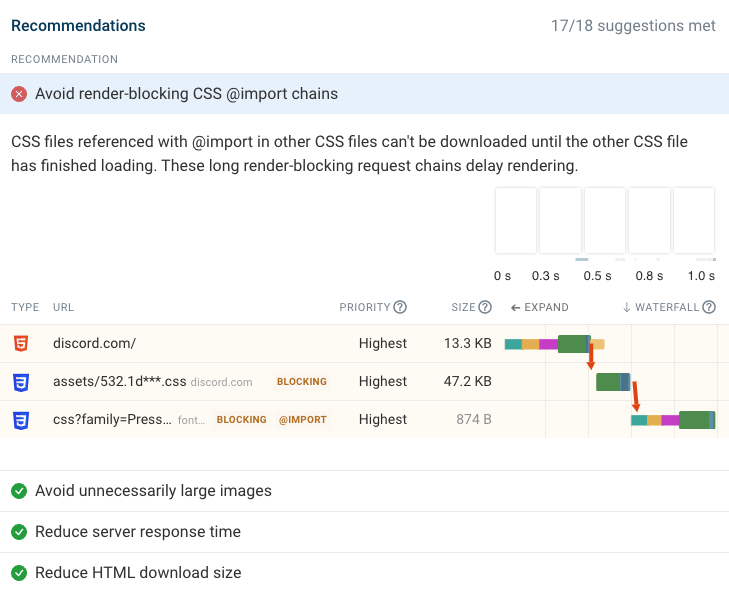 Screenshot of a page speed recommendation in DebugBear, October 2023
3. Watch Your Website Render Frame By Frame
When loading your website on a fast network connection it probably loads in a second or two. Too quick to really see what’s going on step by step.
Using network throttling in Chrome DevTools allows you to see how your website loads on a slower connection. You can watch content appear gradually and use that understanding of the loading process during your optimization efforts.
Follow these steps to load your website using a slower connection:
- Right-click the page and click “Inspect”.
- Open the “Network” tab.
- Open the “No throttling” dropdown and select “Fast 3G”.
- Reload the page.
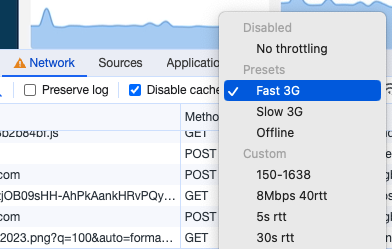 Screenshot of Chrome DevTools request throttling dropdown, October 2023
In the example below you can see that:
- The page starts rendering with a static background before the background image appears.
- A fallback font is used initially until the web font has loaded.
- The image in the center appears last.
Video recording of the rendering process of a website in DebugBear, October 2023
You can also use the free DebugBear test to step through the rendering process frame by frame. Or download the recording as an MP4 with a paid DebugBear subscription.
Video recording of the rendering process of a website in DebugBear, October 2023
4. Focus On Core Web Vitals Instead Of Your Lighthouse Score
Google’s Lighthouse tool is widely used to test website performance. It’s easy to run and delivers a set of actionable recommendations to improve your website.
However, the Lighthouse Performance score is not an SEO ranking signal. Many sites have a poor or average Lighthouse score but do well across all three Core Web Vitals metrics in the real user data that impact rankings.
Lighthouse is good for testing your website in a fixed environment and lets you run before and after tests on your website before updated real user data is available. But what ultimately counts is how your actual visitors experience your website.
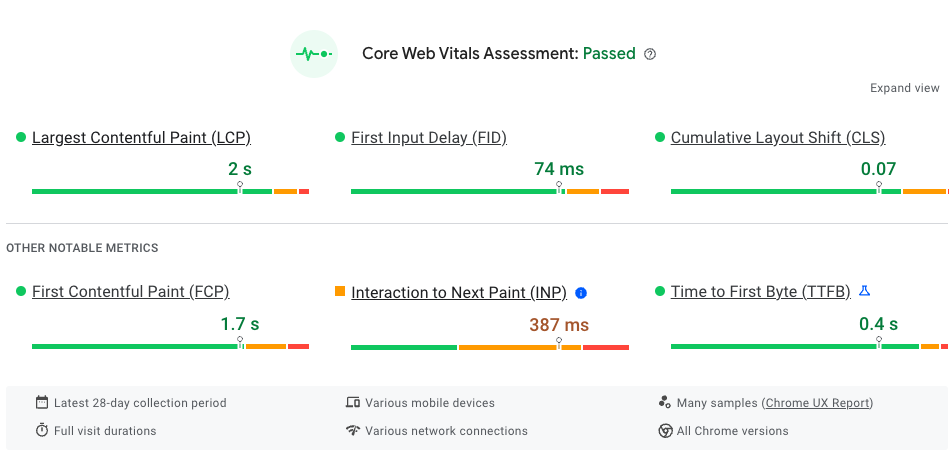 Screenshot of real user Core Web Vitals data in PageSpeed Insights, October 2023
5. Optimize Render-Blocking Resources
Render-blocking resources are files that need to be loaded on your website before browsers can show any content to the user. CSS and JavaScript files in the page <head> often block rendering.
Here’s an example request waterfall showing how render-blocking files impact the rendering process of your website.
- The browser starts with a blank page.
- The HTML document is loaded.
- Several render-blocking resources are loaded (we’ll focus on app.css as the largest and slowest file).
- Once app.css is loaded the page renders (as indicated by the orange CPU task in the waterfall).
- Finally, the page content starts becoming visible in the filmstrip view.
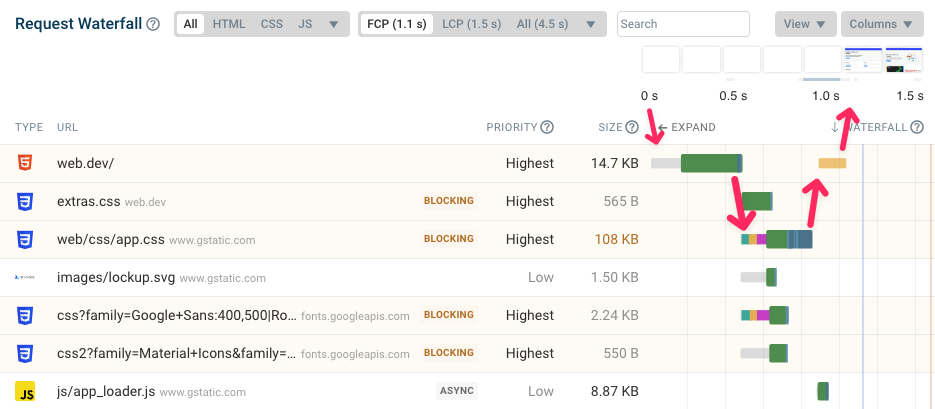 Screenshot of DebugBear’s waterfall visualization showing render-blocking requests, October 2023
Loading many render-blocking resources will make page content appear more slowly and will hurt your Largest Contentful Paint score.
Improve Server Response Time
Loading the initial HTML document is the first step for loading a website. The Time to First Byte (TTFB) metric measures how quickly your web server responds to a request for this resource.
Reduce The Number Of Render-Blocking Requests
The best way to make your website load more quickly is to reduce the number of resources that block rendering. If a file isn’t necessary to start rendering content then it should not block rendering.
For example, the defer and async keywords on the script tag tell the browser that a JavaScript file should be loaded but that the page can start rendering before that.
<script src="https://www.searchenginejournal.com/10-top-tips-to-improve-your-website-speed-spa/499273/app.js" async>Load Render-Blocking Resources More Quickly
To keep the amount of time that rendering is blocked as short as possible you can reduce the size of render-blocking files to speed up the download.
Loading these resources from the same website domain as the HTML document also speeds up these requests, as no additional web server connections are needed.
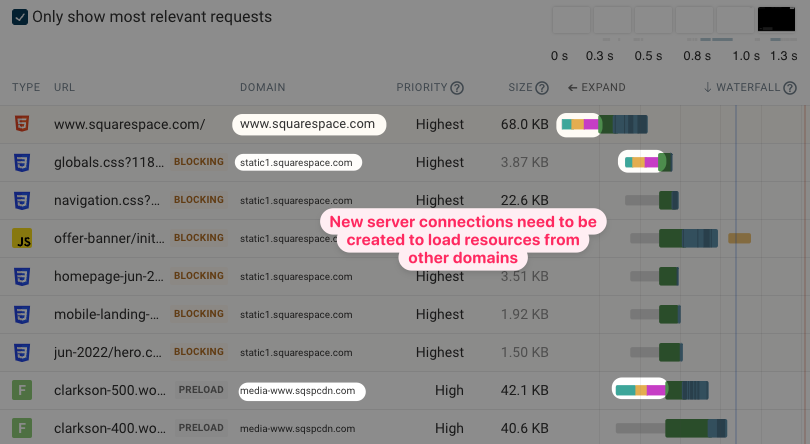 Screenshot of DebugBear’s waterfall showing different server connections, October 2023
6. Load Images With The Right Priority
Some page resources are essential for the page to load, and others can load later on in the page’s lifecycle. There’s only a limited amount of bandwidth available on a network connection, so you want to give browsers appropriate hints about whether a resource is important or can wait until later.
This is especially true for images on your website. When looking at just the HTML browsers can’t tell if a picture appears as a hero image or as a small icon in the website footer. Only when the browser starts displaying content does it realize which images are important.
For important images, you can use the fetchpriority attribute to tell the browser to start loading an image early:
<img src="https://www.searchenginejournal.com/10-top-tips-to-improve-your-website-speed-spa/499273/hero.jpg" fetchpriority="high">Conversely, images further down on the page can be deprioritized by telling the browser to only start loading them when they are close to appearing in the viewport. The img loading attribute makes this easy to implement:
<img src="https://www.searchenginejournal.com/10-top-tips-to-improve-your-website-speed-spa/499273/icon.png" loading="lazy">7. Minimize Page Weight
Page weight measures how many bytes of data need to be downloaded in order to load a web page. The more data needs to be transferred, the longer the download will take. The best way to reduce page weight depends on the type of resources that contribute most to the overall metric.
To reduce the size of images you can use modern image formats like WebP or Avif. These formats use less space to store the same content than PNG or JPEG files.
If text files like HTML documents, CSS stylesheet, or JavaScript code are contributing to your page weight, check if you’re using HTTP compression algorithms like Brotli.
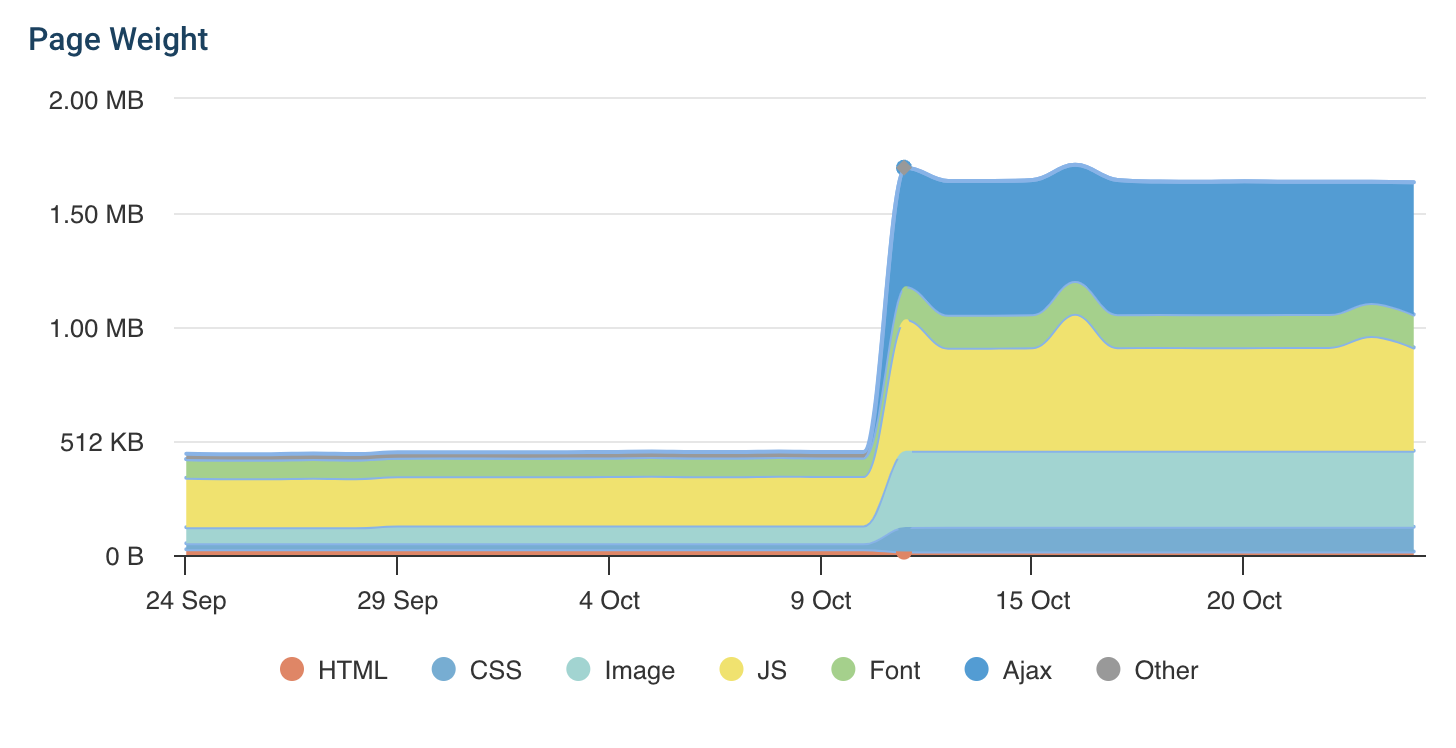 Screenshot of DebugBear’s page weight chart showing an increase in page weight, October 2023
8. Understand Network Request Chains
To load important resources quickly you want to start loading them as early as possible. The browser quickly needs to discover the resource early on, which means it should be referenced in the HTML document.
However, sometimes longer sequential request chains form when loading a website. In the example below, the background image is only referenced from inside a CSS stylesheet. Accordingly, the network request for the image only begins after the stylesheet has finished downloading.
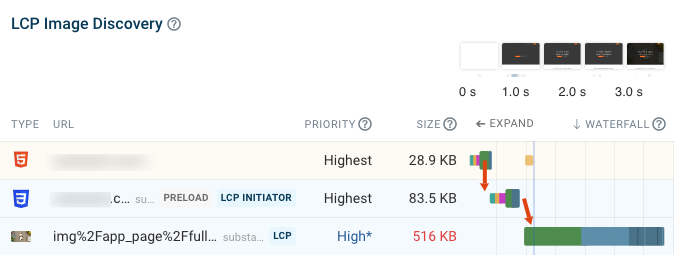 Screenshot of DebugBear’s request waterfall showing a sequential network request chain, October 2023
In these cases, preloads hints in the HTML document can tell the browser to load resources before they would otherwise be discovered. For example:
<link rel="preload" href="https://www.searchenginejournal.com/10-top-tips-to-improve-your-website-speed-spa/499273/background.png" as="image" />9. Use Server-Side Rendering For Single-Page Apps
Single-page apps are websites where the page content is generated by JavaScript code in the browser. They are often built using coding frameworks like React, Vue, or Angular.
The advantage of single-page applications is that page transitions happen without completely reloading all page contents. Once a page is loaded navigations to a different URL on the website are often fast.
However, the initial page load is often slower with single-page apps as application code needs to be loaded and run to display the page contents. Visitors may just see a spinner or content placeholder initially while they wait for the page to load fully.
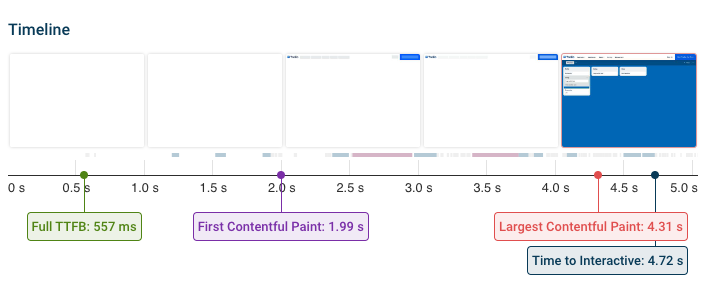 Screenshot of DebugBear’s filmstrip showing the rendering process of a single-page application, October 2023
To address this issue, the initial page content should be rendered on the server, using server-side rendering. That way the page content loads like a traditional HTML document at first and then transitions to a client-side application.
10. Continuously Monitor Your Page Speed
Running a speed test on your website tells you how fast your website is today and what you can do to improve it.
However, continuously monitoring your website with DebugBear helps your team stay on top of website performance issues and ensures you get alerted if there’s a problem. Having history available over time helps you communicate with management and makes it easier to investigate newly introduced issues.
Google Core Web Vitals data is aggregated over a 28-day period, so when a regression occurs it takes a while to show in the Google data. Scheduling daily tests ensures you get notified of new issues before they impact your rankings.
This screenshot shows an example of a Largest Contentful Paint regression that first shows up in the lab data and then gradually starts to push up the Google data.
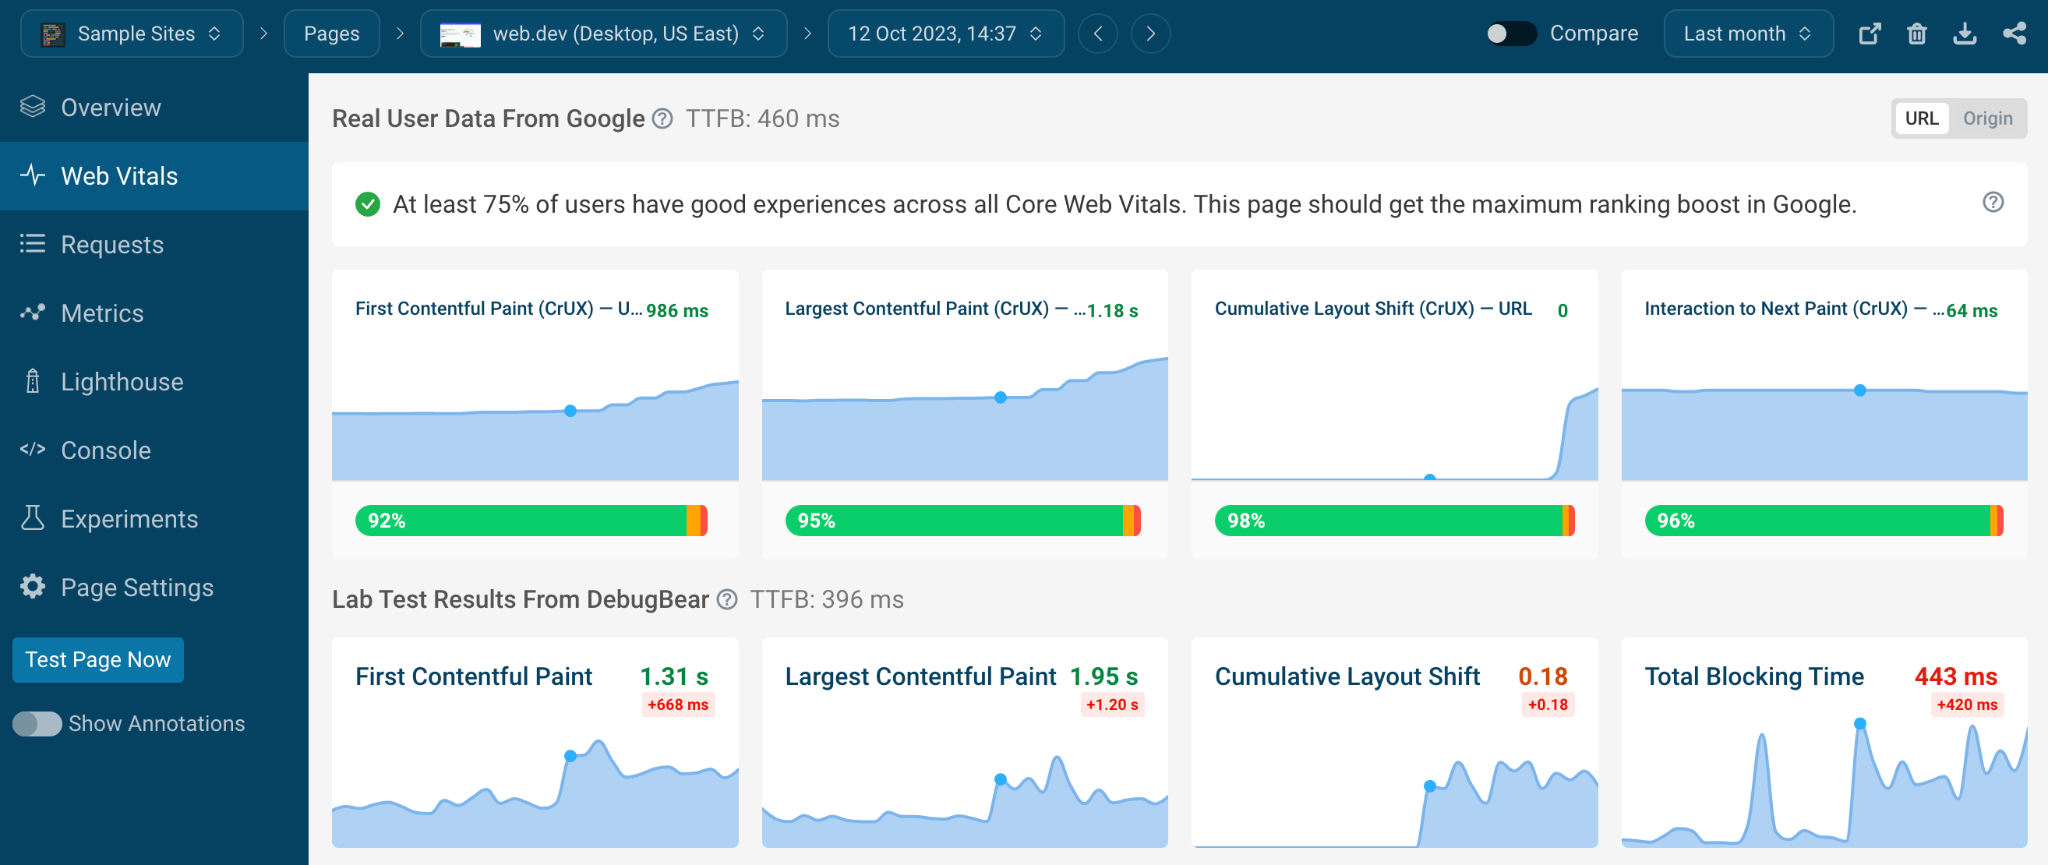 Screenshot of DebugBear’s monitoring data showing a page speed regression impacting Core Web Vitals, October 2023
DebugBear also provides an Experiments feature that lets you try out site speed improvements without having to deploy code. That way you can go to your development with concrete ideas and an estimate of the performance impact they will have.
You can select from over 20+ test locations, analyze pages that require login or are hosted on a staging server, and keep track of your Lighthouse Performance, Accessibility, and SEO scores.
In addition to running scheduled lab tests DebugBear also offers real-user page speed monitoring. By installing an analytics snippet you can see where on your website your visitors are having a good experience and what pages you need to work on.
While lab data looks at a single consistent type of experience, real-user data better captures the full diversity of visitor experiences. Some visitors will be on slow mobile connections, use an older browser, or visit your website from a location that’s far from your website server.
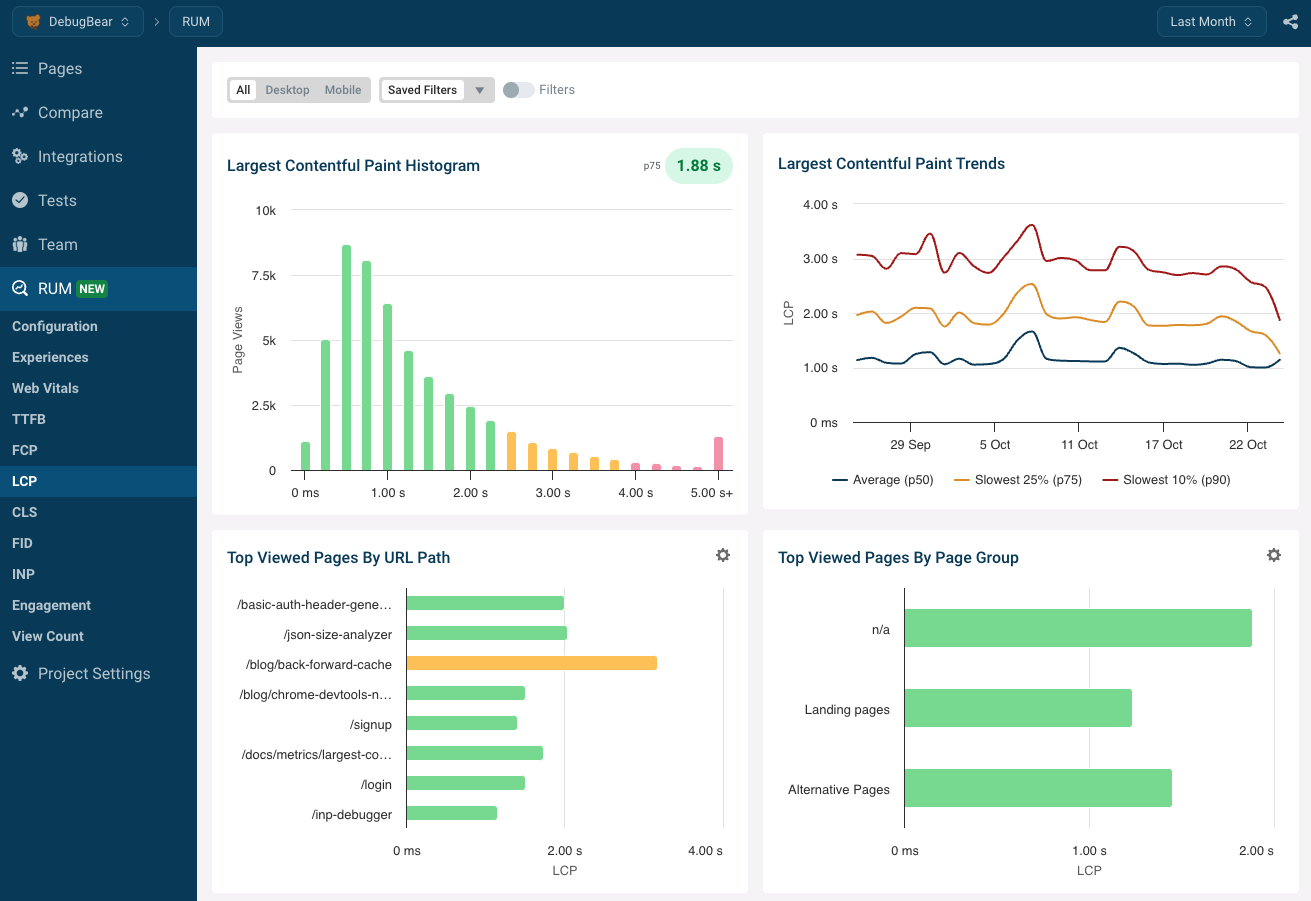 Screenshot of DebugBear’s real user dashboard for the Largest Contentful Paint, October 2023
Real user monitoring also allows you to debug the new Interaction to Next Paint (INP) metric that becomes one of Google’s Core Web Vitals in March 2024.
How responsive your website is for a user depends a lot on what your website is responding to: what page element is the user trying to interact with? DebugBear RUM keeps track of what UI elements users interact with most often and how quickly those elements are to user input.
With this data you know what interactions to focus on when you decide to optimize INP.
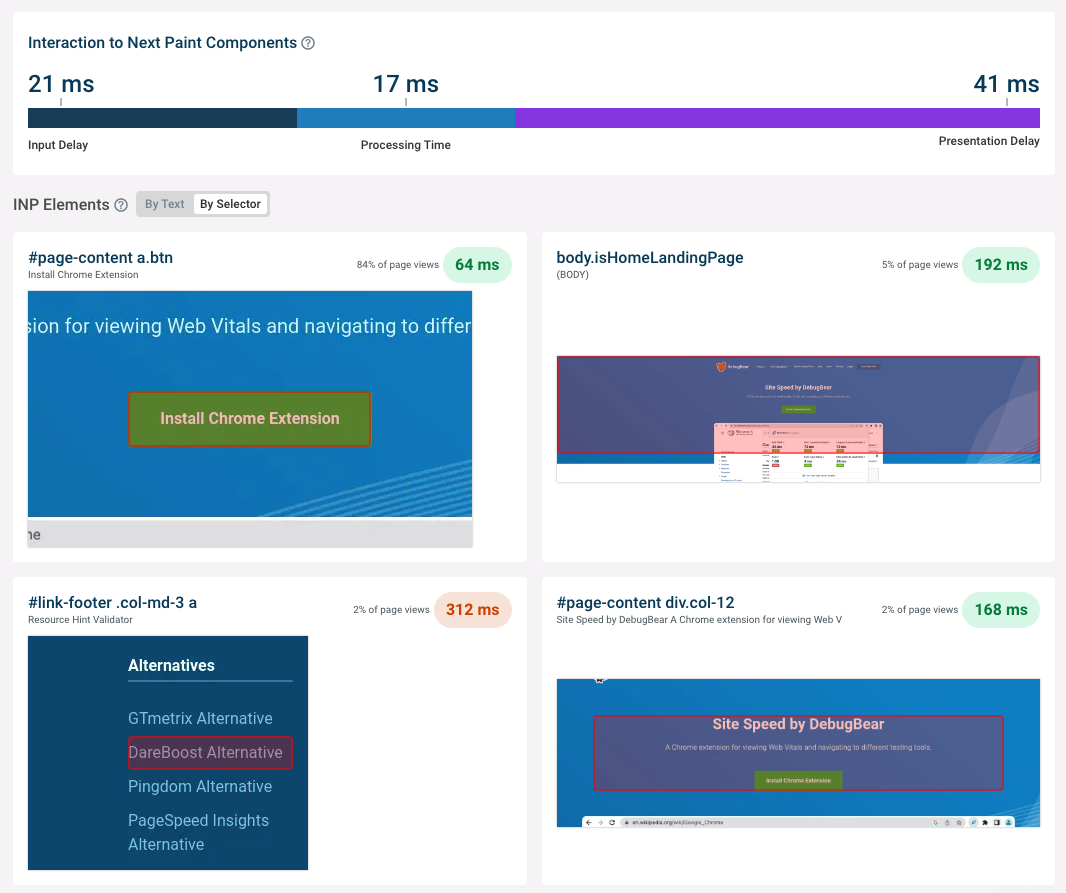 Screenshot of DebugBear’s RUM dashboard showing an Interaction to Next Paint analysis, October 2023
DebugBear provides a comprehensive suite of page speed monitoring features that empower your team to deliver great experiences. Sign up for a free trial today!
Ready to start optimizing your website? Sign up for DebugBear and get the data you need to deliver great user experiences.
Image Credits
Featured Image: Image by DebugBear. Used with permission.
