The SEO field has no shortage of acronyms.
From SEO to FID to INP – these are some of the more common ones you will run into when it comes to page speed.
There’s a new metric in the mix: INP, which stands for Interaction to Next Paint. It refers to how the page responds to specific user interactions and is measured by Google Chrome’s lab data and field data.
What, Exactly, Is Interaction To Next Paint?
Interaction to Next Paint, or INP, is a new Core Web Vitals metric designed to represent the overall interaction delay of a page throughout the user journey.
For example, when you click the Add to Cart button on a product page, it measures how long it takes for the button’s visual state to update, such as changing the color of the button on click.
If you have heavy scripts running that take a long time to complete, they may cause the page to freeze temporarily, negatively impacting the INP metric.
Here is the example video illustrating how it looks in real life:
Notice how the first button responds visually instantly, whereas it takes a couple of seconds for the second button to update its visual state.
How Is INP Different From FID?
The main difference between INP and First Input Delay, or FID, is that FID considers only the first interaction on the page. It measures the input delay metric only and doesn’t consider how long it takes for the browser to respond to the interaction.
In contrast, INP considers all page interactions and measures the time browsers need to process them. INP, however, takes into account the following types of interactions:
- Any mouse click of an interactive element.
- Any tap of an interactive element on any device that includes a touchscreen.
- The press of a key on a physical or onscreen keyboard.
What Is A Good INP Value?
According to Google, a good INP value is around 200 milliseconds or less. It has the following thresholds:
| Threshold Value | Description |
| 200 | Good responsiveness. |
| Above 200 milliseconds and up to 500 milliseconds | Moderate and needs improvement. |
| Above 500 milliseconds | Poor responsiveness. |
Google also notes that INP is still experimental and that the guidance it recommends regarding this metric is likely to change.
How Is INP Measured?
Google measures INP from Chrome browsers anonymously from a sample of the single longest interactions that happen when a user visits the page.
Each interaction has a few phases: presentation time, processing time, and input delay. The callback of associated events contains the total time involved for all three phases to execute.
If a page has fewer than 50 total interactions, INP considers the interaction with the absolute worst delay; if it has over 50 interactions, it ignores the longest interactions per 50 interactions.
When the user leaves the page, these measurements are then sent to the Chrome User Experience Report called CrUX, which aggregates the performance data to provide insights into real-world user experiences, known as field data.
What Are The Common Reasons Causing High INPs?
Understanding the underlying causes of high INPs is crucial for optimizing your website’s performance. Here are the common causes:
- Long tasks that can block the main thread, delaying user interactions.
- Synchronous event listeners on click events, as we saw in the example video above.
- Changes to the DOM cause multiple reflows and repaints, which usually happens when the DOM size is too large ( > 1,500 HTML elements).
How To Troubleshoot INP Issues?
First, read our guide on how to measure CWV metrics and try the troubleshooting techniques offered there. But if that still doesn’t help you find what interactions cause high INP, this is where the “Performance” report of the Chrome (or, better, Canary) browser can help.
- Go to the webpage you want to analyze.
- Open DevTools of your Canary browser, which doesn’t have browser extensions (usually by pressing F12 or Ctrl+Shift+I).
- Switch to the Performance tab.
- Disable cache from the Network tab.
- Choose mobile emulator.
- Click the Record button and interact with the page elements as you normally would.
- Stop the recording once you’ve captured the interaction you’re interested in.
Throttle the CPU by 4x using the “slowdown” dropdown to simulate average mobile devices and choose a 4G network, which is used in 90% of mobile devices when users are outdoors. If you don’t change this setting, you will run your simulation using your PC’s powerful CPU, which is not equivalent to mobile devices.
It is a highly important nuance since Google uses field data gathered from real users’ devices. You may not face INP issues with a powerful device – that is a tricky point that makes it hard to debug INP. By choosing these settings, you bring your emulator state as close as possible to the real device’s state.
Here is a video guide that shows the whole process. I highly recommend you try this as you read the article to gain experience.
What we have spotted in the video is that long tasks cause interaction to take longer and a list of JavaScript files that are responsible for those tasks.
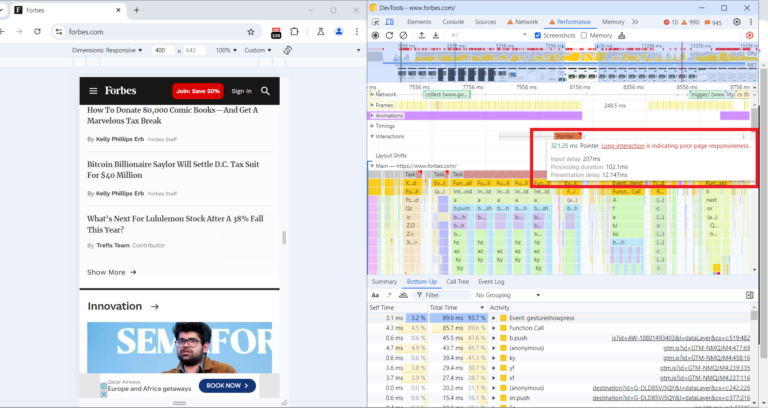
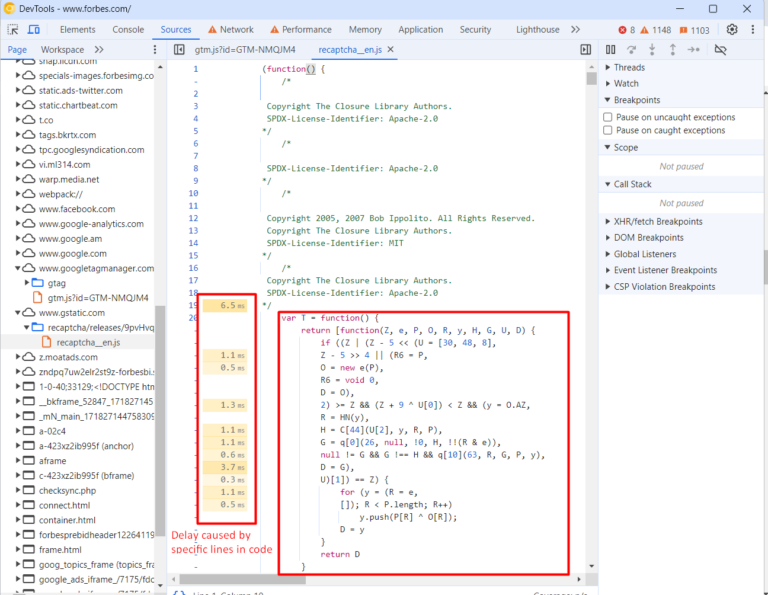
If you expand the Interactions section, you can see a detailed breakdown of the long task associated with that interaction, and clicking on those script URLs will open JavaScript code lines that are responsible for the delay, which you can use to optimize your code.
A total of 321 ms long interaction consists of:
- Input delay: 207 ms.
- Processing duration: 102 ms.
- Presentation delay: 12 ms.
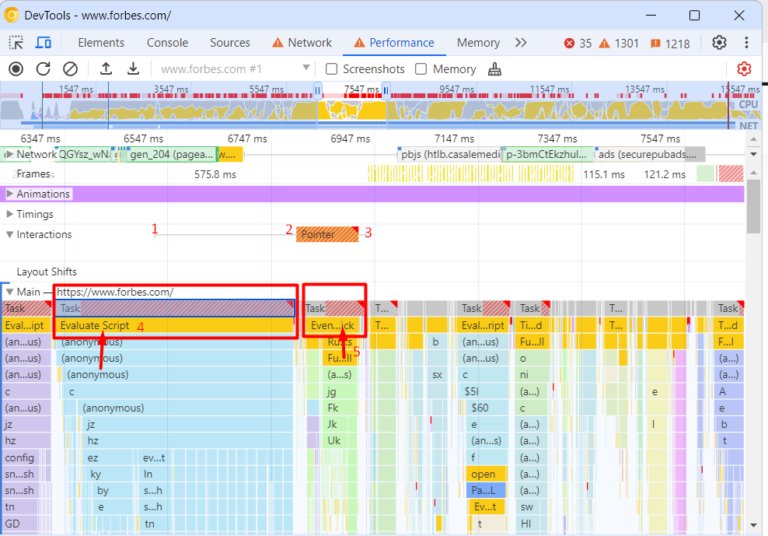
Below in the main thread timeline, you’ll see a long red bar representing the total duration of the long task.
Underneath the long red taskbar, you can see a yellow bar labeled “Evaluate Script,” indicating that the long task was primarily caused by JavaScript execution.
In the first screenshot time distance between (point 1) and (point 2) is a delay caused by a red long task because of script evaluation.
What Is Script Evaluation?
Script evaluation is a necessary step for JavaScript execution. During this crucial stage, the browser executes the code line by line, which includes assigning values to variables, defining functions, and registering event listeners.
Users might interact with a partially rendered page while JavaScript files are still being loaded, parsed, compiled, and evaluated.
When a user interacts with an element (clicks, taps, etc.) and the browser is in the stage of evaluating a script that contains an event listener attached to the interaction, it may delay the interaction until the script evaluation is complete.
This ensures that the event listener is properly registered and can respond to the interaction.
In the screenshot (point 2), the 207 ms delay likely occurred because the browser was still evaluating the script that contained the event listener for the click.
This is where Total Blocking Time (TBT) comes in, which measures the total amount of time that long tasks (longer than 50 ms) block the main thread until the page becomes interactive.
If that time is long and users interact with the website as soon as the page renders, the browser may not be able to respond promptly to the user interaction.
It is not a part of CWV metrics but often correlates with high INPs. So, in order to optimize for the INP metric, you should aim to lower your TBT.
What Are Common JavaScripts That Cause High TBT?
Analytics scripts – such as Google Analytics 4, tracking pixels, google re-captcha, or AdSense ads – usually cause high script evaluation time, thus contributing to TBT.
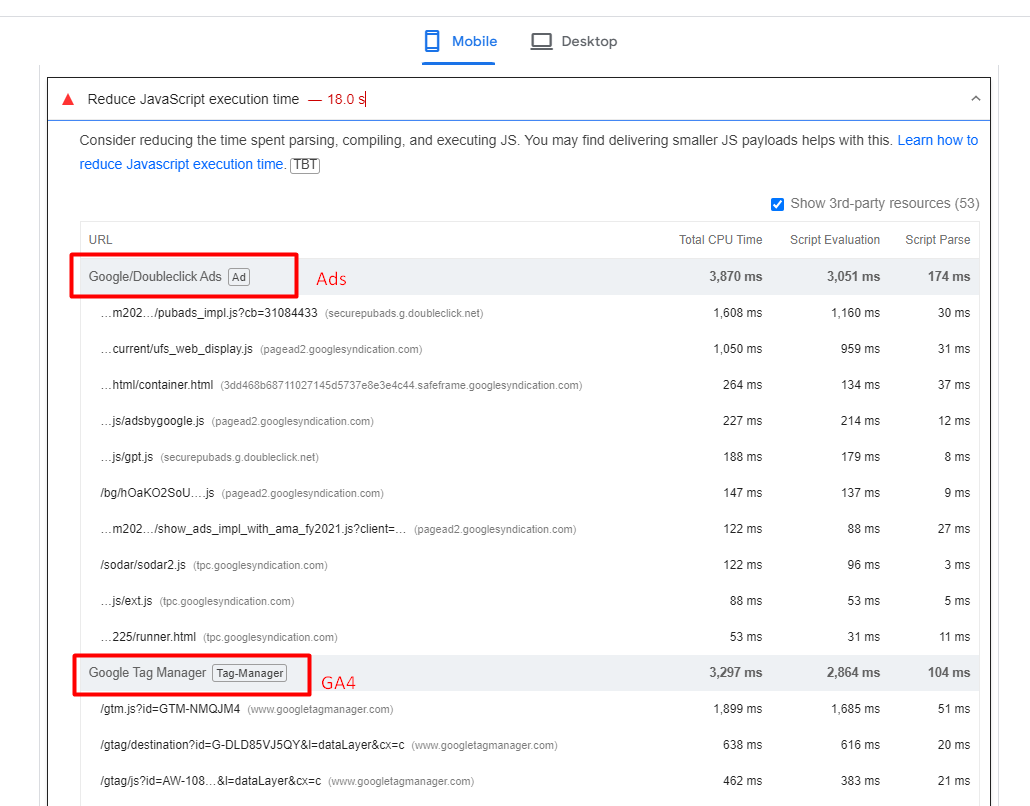 An example of a website where ads and analytics scripts cause high JavaScript execution time.
One strategy you may want to implement to reduce TBT is to delay the loading of non-essential scripts until after the initial page content has finished loading.
Another important point is that when delaying scripts, it’s essential to prioritize them based on their impact on user experience. Critical scripts (e.g., those essential for key interactions) should be loaded earlier than less critical ones.
Improving Your INP Is Not A Silver Bullet
It’s important to note that improving your INP is not a silver bullet that guarantees instant SEO success.
Instead, it is one item among many that may need to be completed as part of a batch of quality changes that can help make a difference in your overall SEO performance.
These include optimizing your content, building high-quality backlinks, enhancing meta tags and descriptions, using structured data, improving site architecture, addressing any crawl errors, and many others.
More resources:
Featured Image: BestForBest/Shutterstock
