Does Lighthouse Score Impact My Website Ranking?
Unlike the Core Web Vitals, the Lighthouse score does not impact your search engine rankings. Even if Lighthouse gives you a low score, your real users might still have a good experience on your website.
In addition to the Core Web Vitals metrics, many performance tools will also show you a Performance score between 0 and 100.
This is called the Lighthouse Performance score, based on Google’s Lighthouse testing tool that many other site speed tests are built on top of.
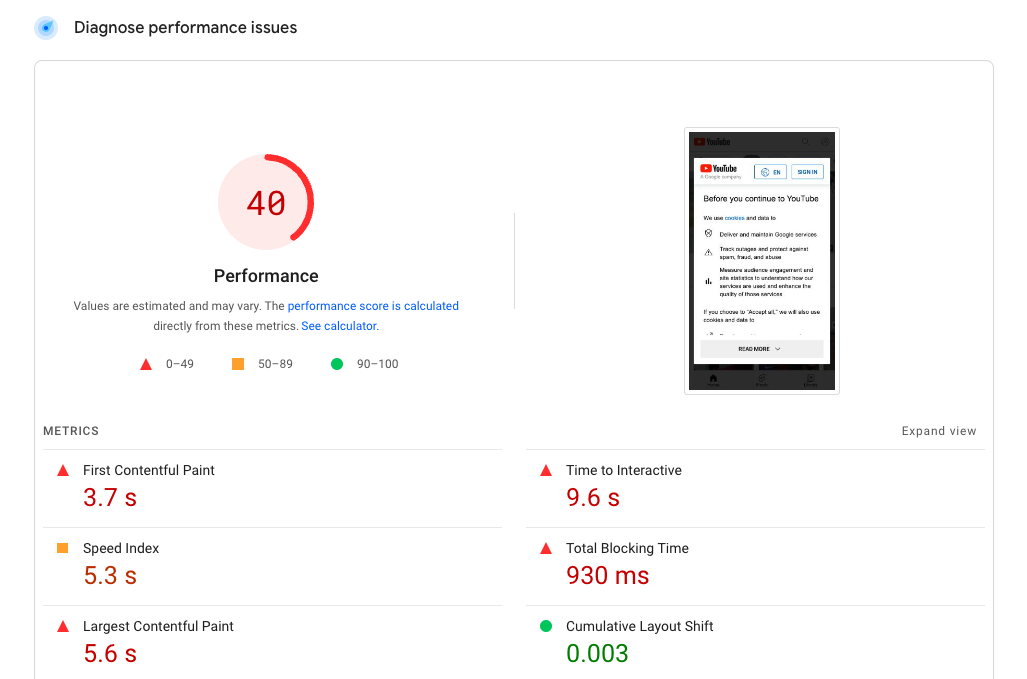 Screenshot of a site speed test result from PageSpeed Insights, October 2022
This score provides a high-level evaluation of your website.
However, when optimizing your pages, you can ignore it and instead focus on the specific metrics you want to improve.
So, let’s start improving the website speed metrics that really matter – Core Web Vitals.
Step 1: Check If You Need To Optimize Your Core Web Vitals
Visit Search Console, a Google tool that provides in-depth reporting on how well your website does in search results.
If you have Search Console configured on your site, you can quickly see your website’s live Core Web Vitals reports. If not, here’s how to get your website set up on Google Search Console.
This Core Web Vitals tab shows how well your website is doing according to Google’s user experience metrics.
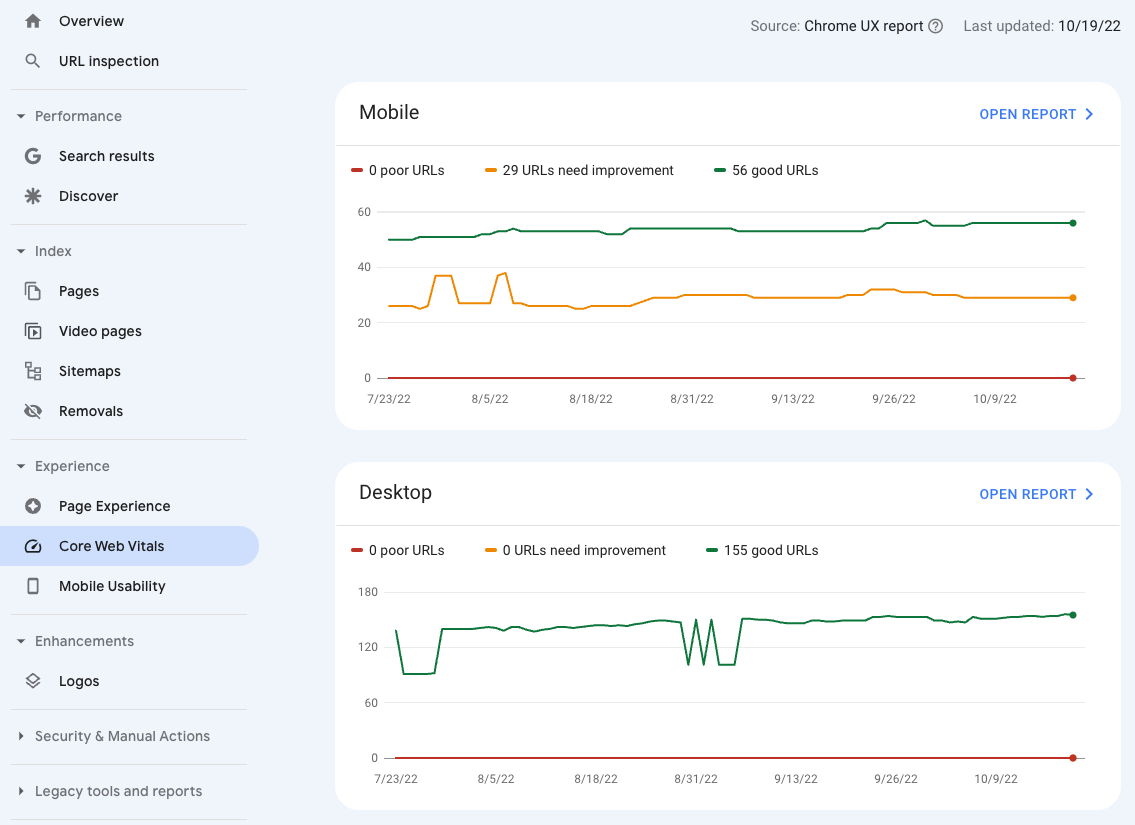 Screenshot of Core Web Vitals reports in Google Search Console, October 2022
If you have only “good URLs” then you’re doing well and don’t have to worry about further optimizing Core Web Vitals for SEO.
But, if some of your pages are marked as “poor” or “needs improvement”, then improving the Core Web Vitals metrics could help your site rank higher on Google.
Step 2: Identify The Slow Pages On Your Website
Individual slow pages on your website can drag down the metrics and experience of your full website. So, it’s important to locate and repair each page that is returning a “poor” or “needs improvement” score.
How To Identify Individual Slow Pages In Search Console
If your website gets a lot of traffic, this step is easy.
- Open the Core Web Vitals tab.
- Click “Open Report” for the mobile or desktop data.
- Select one of the issues listed under “Why URLs aren’t considered good.”
- Click one of the URL groups with an issue.
Google will provide URL-level data for the example pages in the group, and you can focus your efforts on the pages that perform worst on the Core Web Vitals.
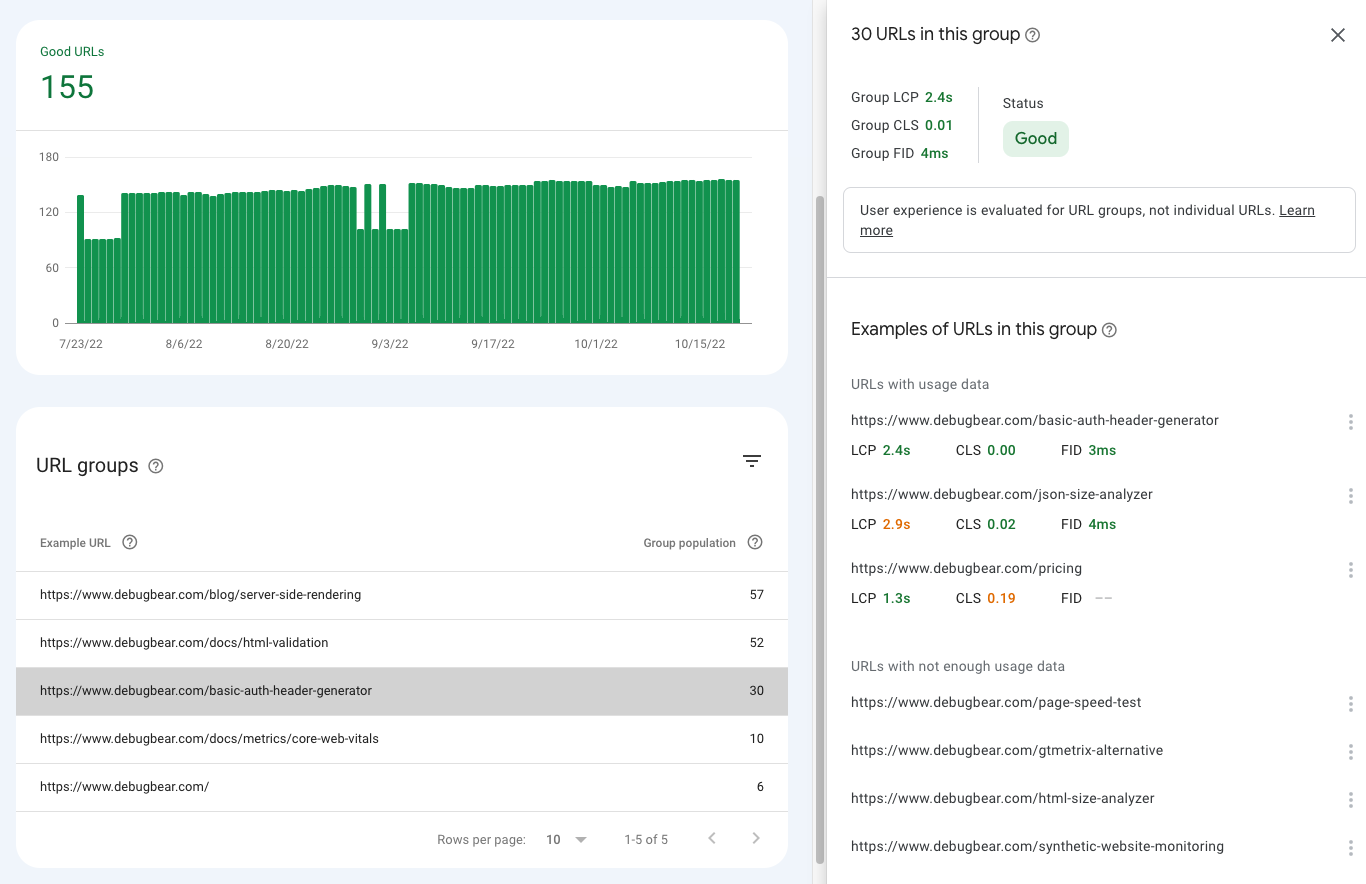 Detailed information about a URL group in Google Search Console, October 2022
However, once you’re inside your Search Console, you may see only see data for “URL groups” instead of individual pages; that’s perfectly normal.
If you have a newer website that doesn’t get much traffic, Google will combine multiple URLs into a single URL group and rate the group according to the Core Web Vitals.
Chances are, the pages within that URL group are so similar that the changes you make to one page can be duplicated for the other pages in the group.
How To View Slow URL Groups In Search Console
Google Search Console sometimes categorizes similar pages on your website into URL groups. This is because most pages on your website likely don’t get enough traffic by themselves for Google to have sufficient performance data.
Use the detailed desktop and mobile Core Web Vitals reports in Google Search Console to find out what parts of your website are slow.
In the same area as before, you can also see your slow URL groups.
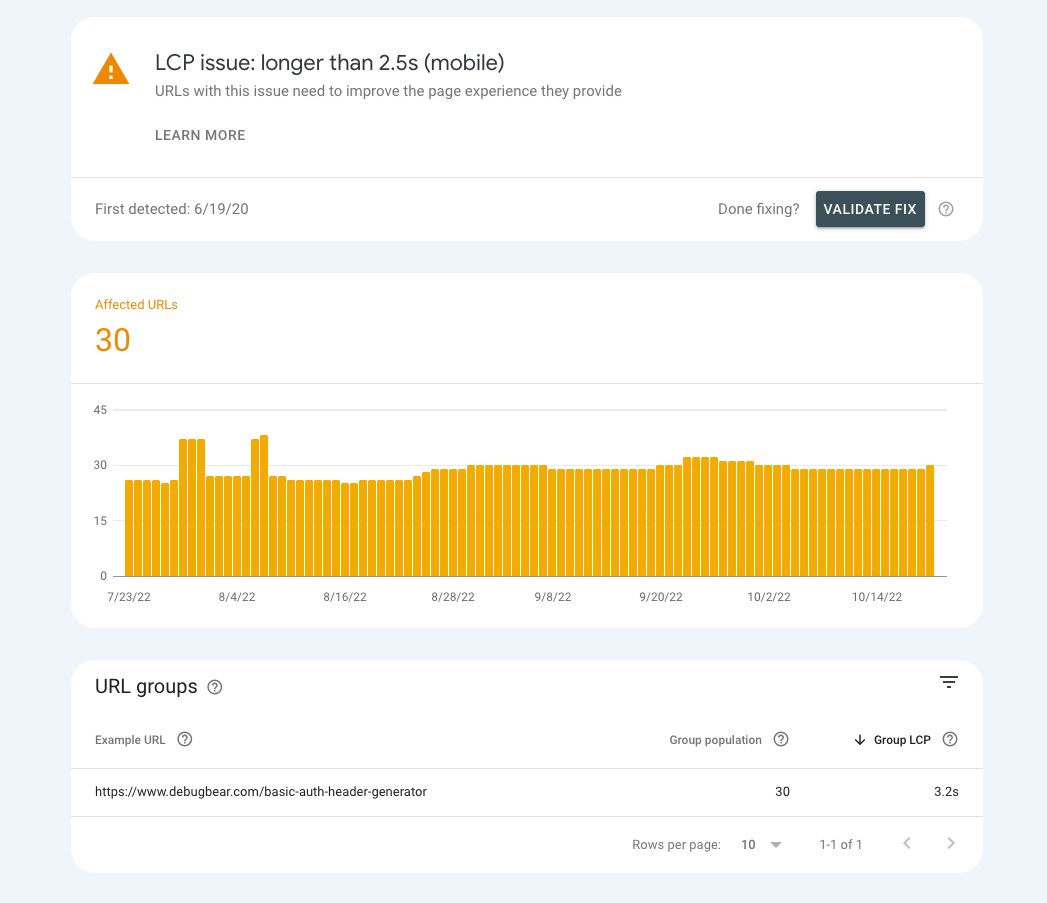 A slow URL group shown in Google Search Console, October 2022
In the screenshot above, we can see that there’s a group of 30 URLs on the website that don’t meet the Largest Contentful Paint threshold.
By default, Search Console shows one example URL from the group. You can click on the group to see the full list of URLs in the group.
But just because a group of URLs is slow that doesn’t mean that every single page in that group is slow. You need to investigate further to identify what pages you need to optimize.
How To Test Individual Page Speed For URLs Inside Of A URL Group
If you’re seeing a long list of “URLs with not enough usage data,” we have a solution for you.
Google only provides URL-level performance data for individual pages that receive enough traffic to record data from.
Since you don’t have enough real user data, your best option is to run lab-based performance tests to see which pages in the URL group are slow.
Lab-based tests are run in a controlled environment used to measure page performance.
The lab data won’t match the field data, but you can use it to rank your pages and identify the slowest ones.
You can use a free site speed testing tool to run your tests, or use DebugBear to test pages in bulk and rank them by the Core Web Vitals metrics.
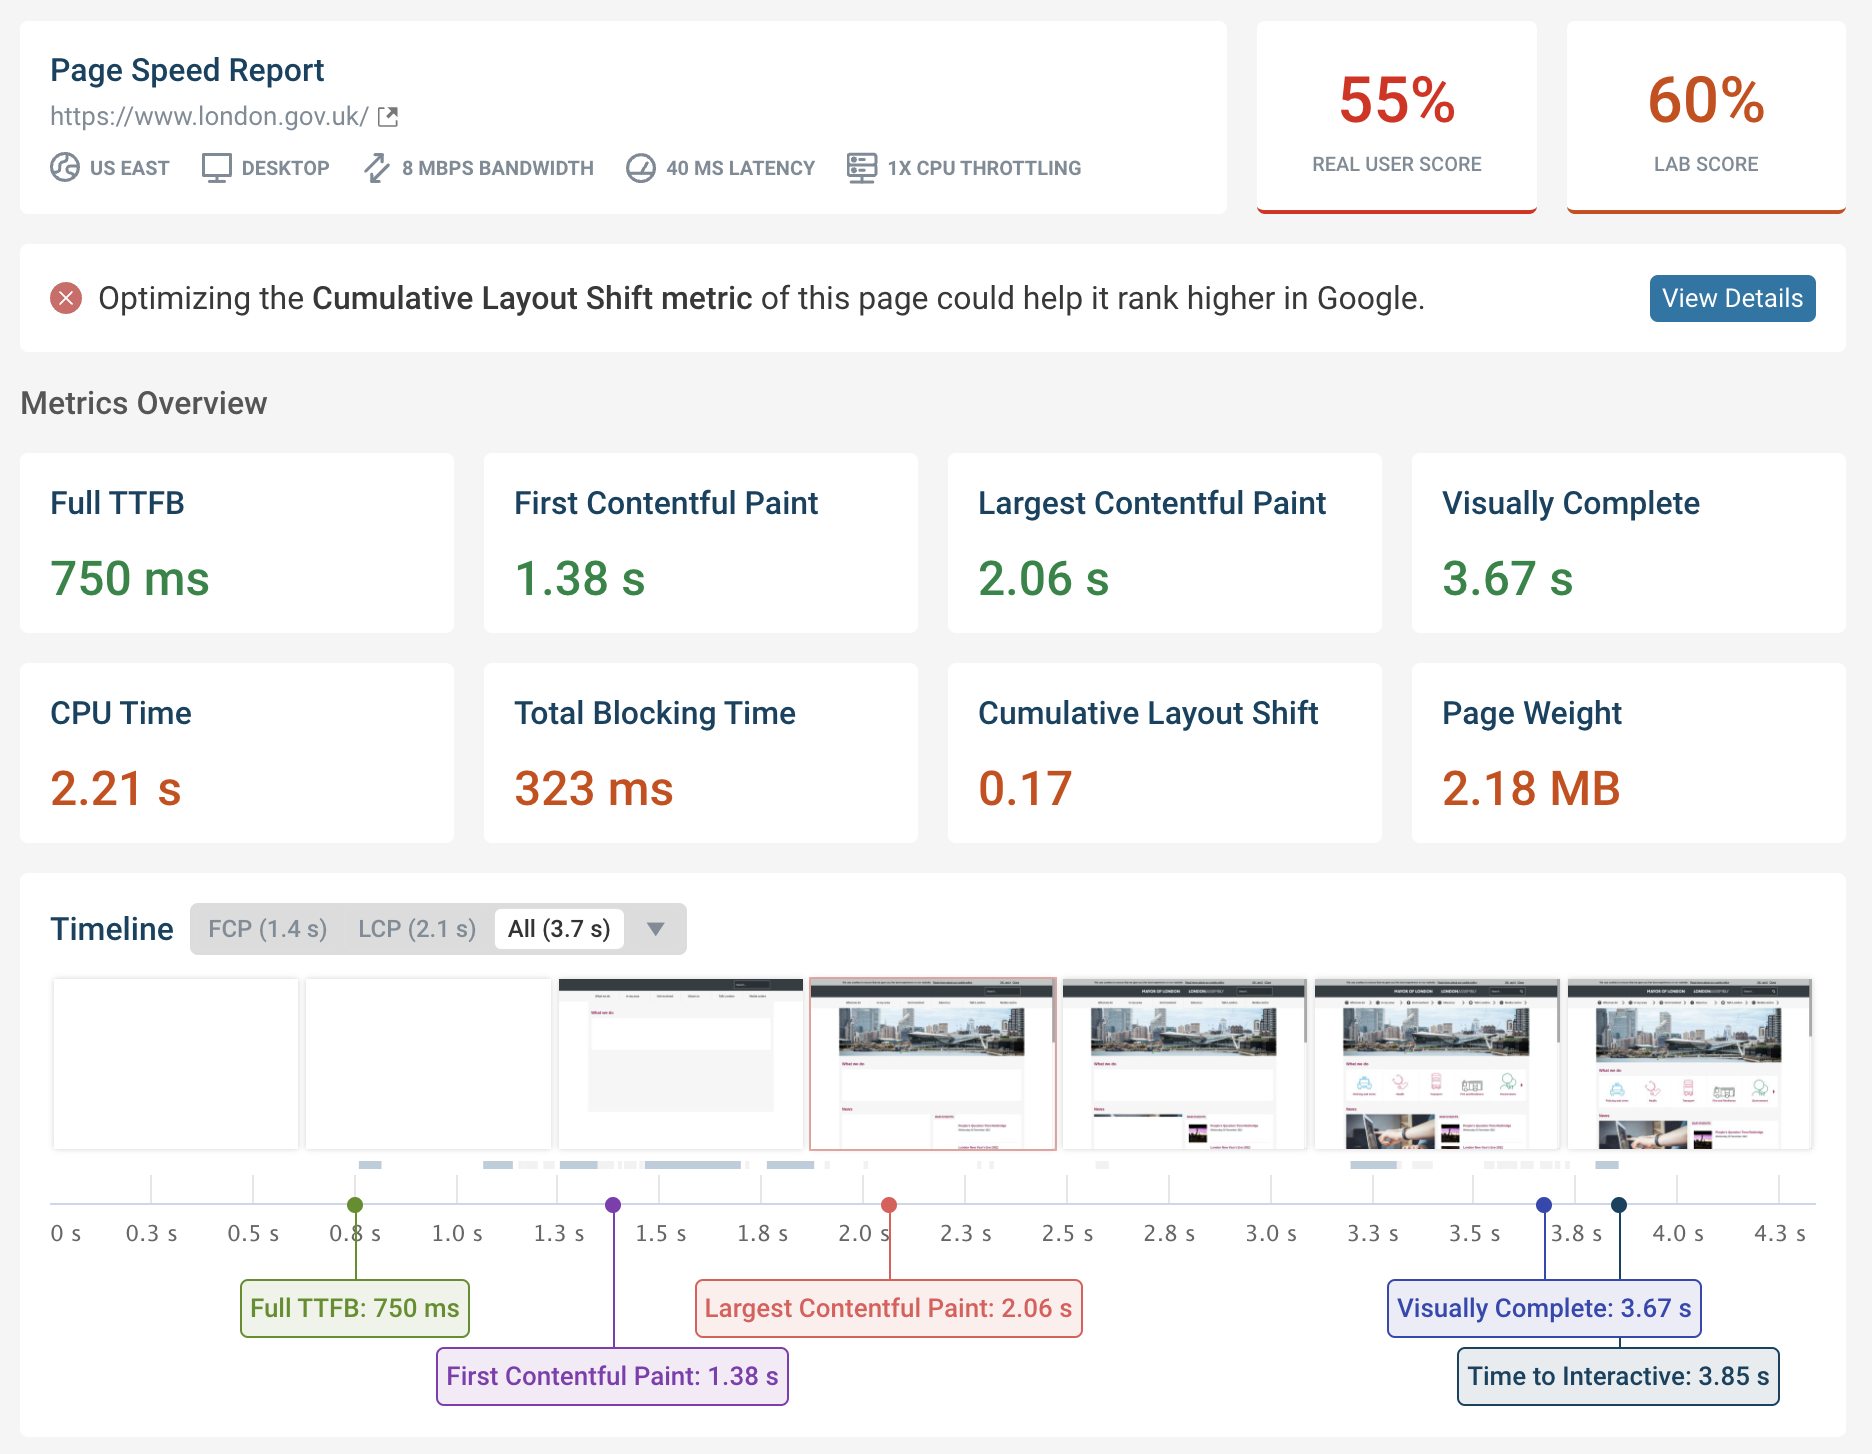 A DebugBear site speed test result, October 2022
Step 3: Set Up Monitoring For Key Pages On Your Website
Once you’ve identified which pages are underperforming, you’ll want to continuously monitor your website to detect performance changes more quickly.
DebugBear both runs continuous lab-based tests and tracks Google’s real user data over time. This way you can confirm that your Core Web Vitals improvements are working and get alerted to any accidental regressions that occur.
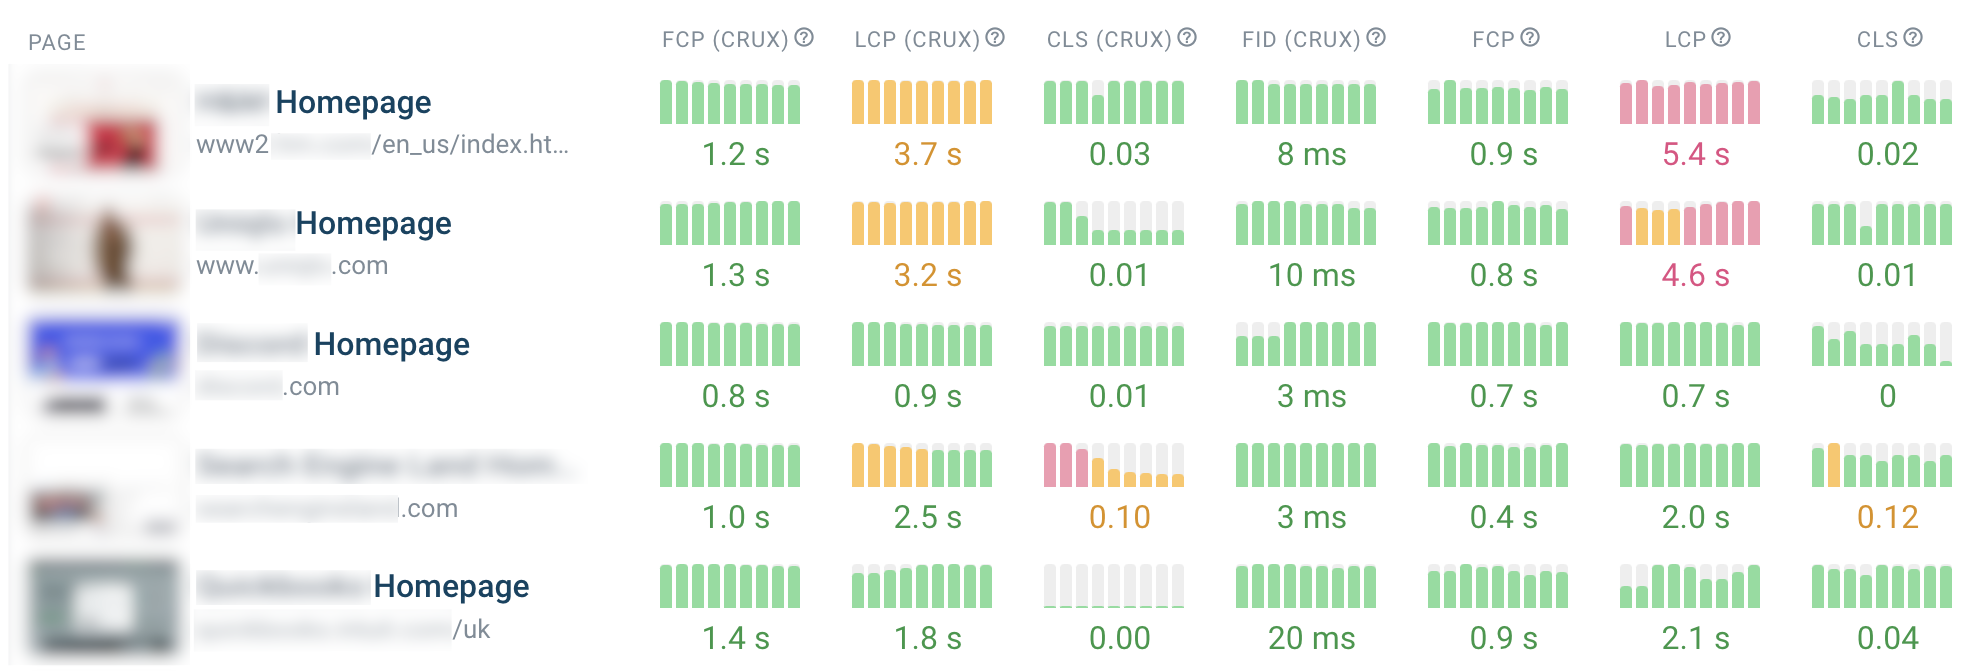 Core Web Vitals monitoring data in DebugBear, October 2022
Which Pages Should You Monitor Continuously?
There are three types of pages that you should consider monitoring:
- Specific pages that you identified as having poor Core Web Vitals.
- Key high-traffic pages like your homepage.
- Equivalent competitor pages so that you can compare and benchmark.
Pro Tip: Identify different page categories on your website and monitor one or two URLs for each type of page.
Pages within a category will have similar performance characteristics. Monitoring 50 similar pages generally won’t help you catch additional performance problems.
Step 4: Run In-Depth Performance Tests On Slow Pages To Identify Potential Fixes
With a performance test, you’ll be able to learn the exact causes for “needs improvement” or “poor” Core Web Vitals scores.
To run a performance test on your individual slow pages:
- Visit: Go to debugbear.com/test.
- Test: Enter the URL of your slow webpage.
- Review: Analyze your Core Web Vitals results and read the recommendations in your report to speed up your site.
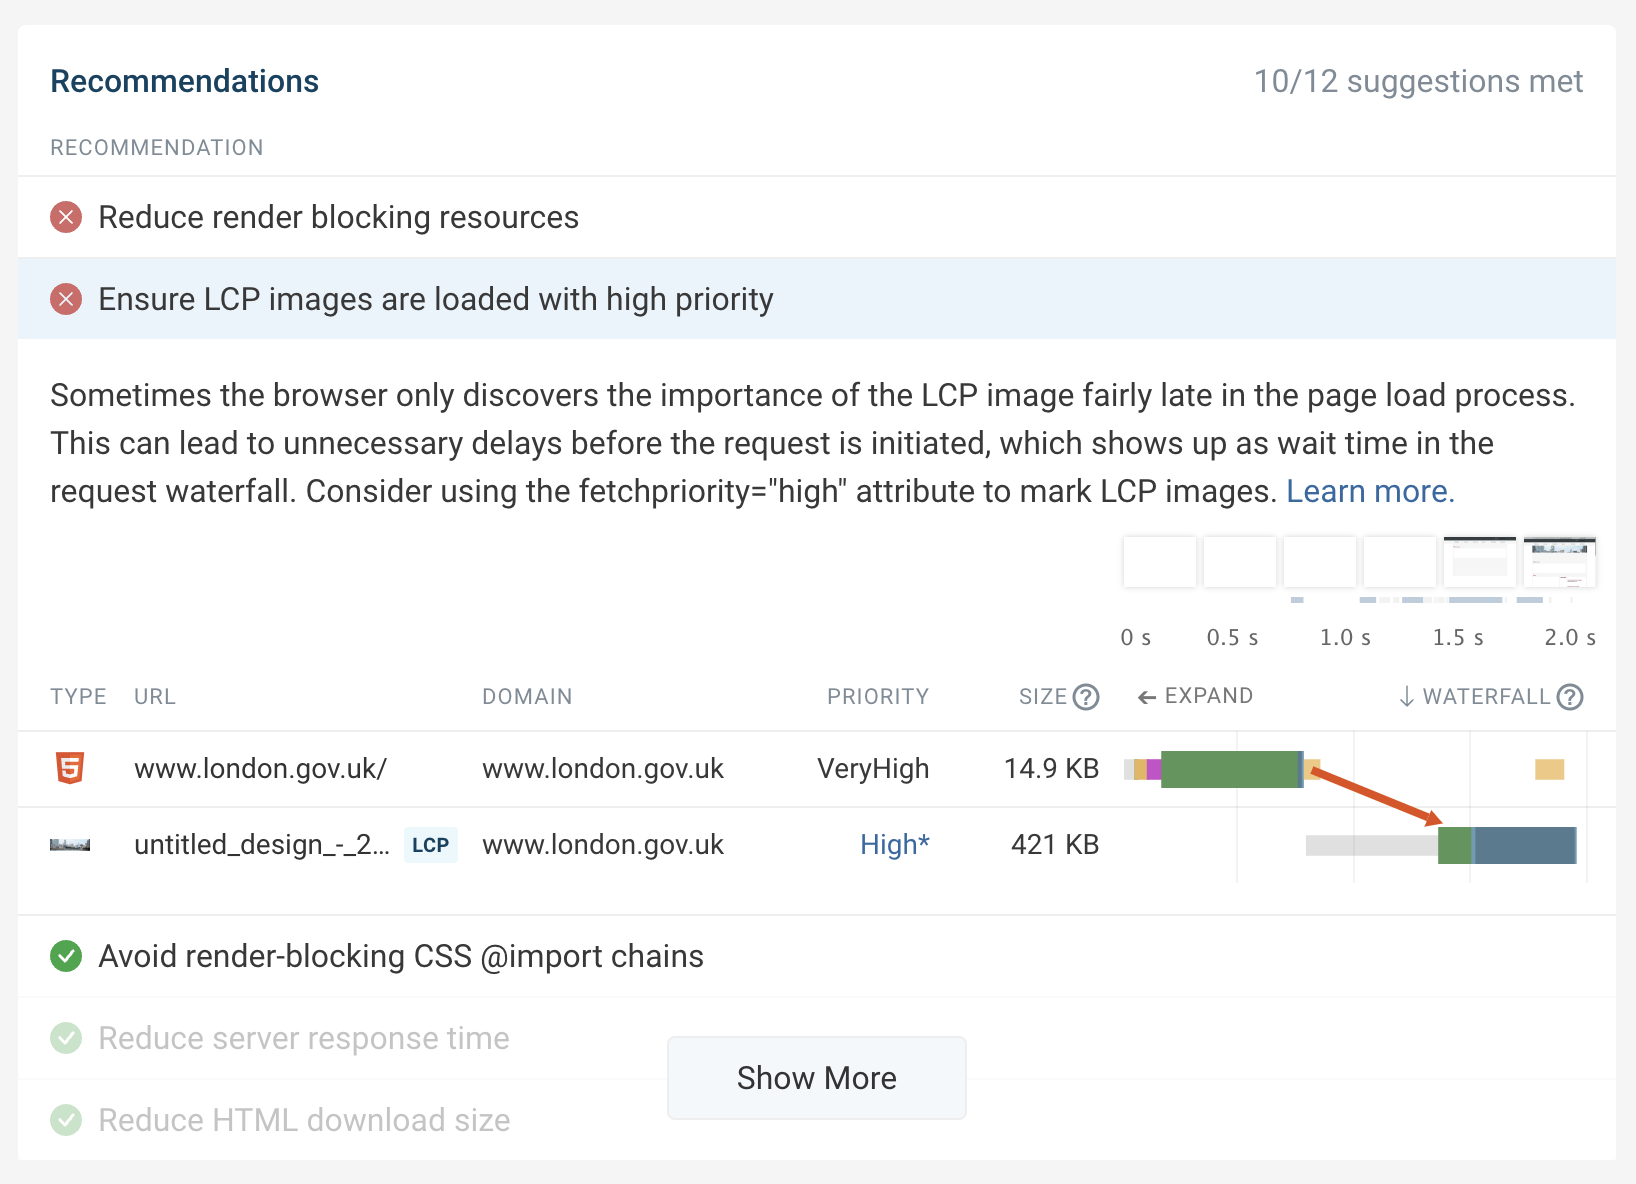 A recommendation to speed up Largest Contentful Paint in DebugBear, October 2022
How To Analyze Largest Contentful Paint Scores
Largest Contentful Paint (LCP) measures how soon after navigation the largest content element shows up on the page.
So the first step is identifying the LCP element – for example, a big image or heading on the page.
Once that’s done, you can look into what you can do to load the resources necessary to show that content more quickly.
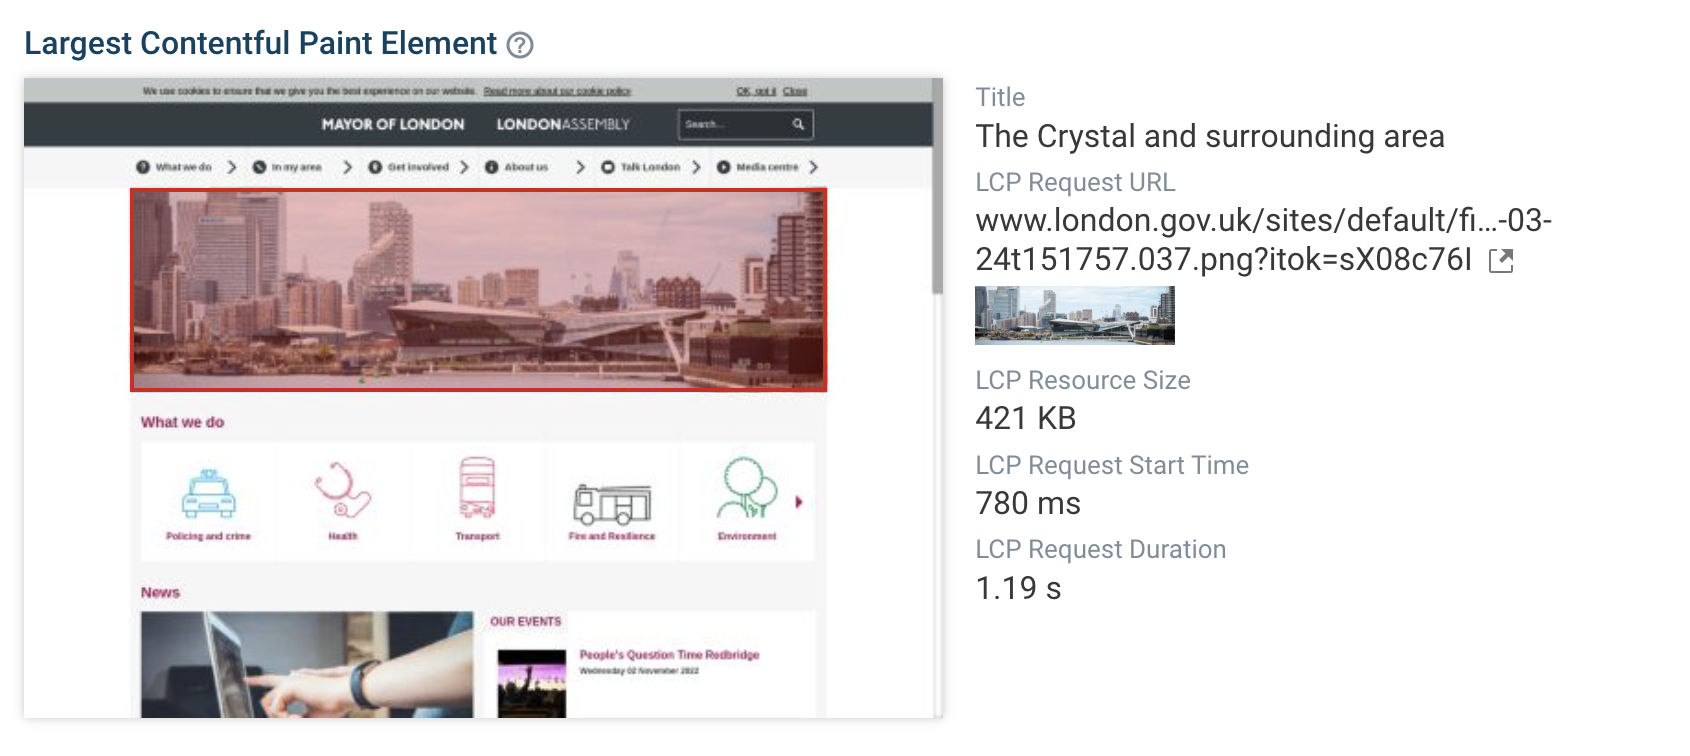 Detailed information about the Largest Contentful Paint element in DebugBear, October 2022
How To Analyze Cumulative Layout Shift Scores
Cumulative Layout Shift measures how stable the layout is after rendering.
To reduce it, check what UI elements change position after the initial page load.
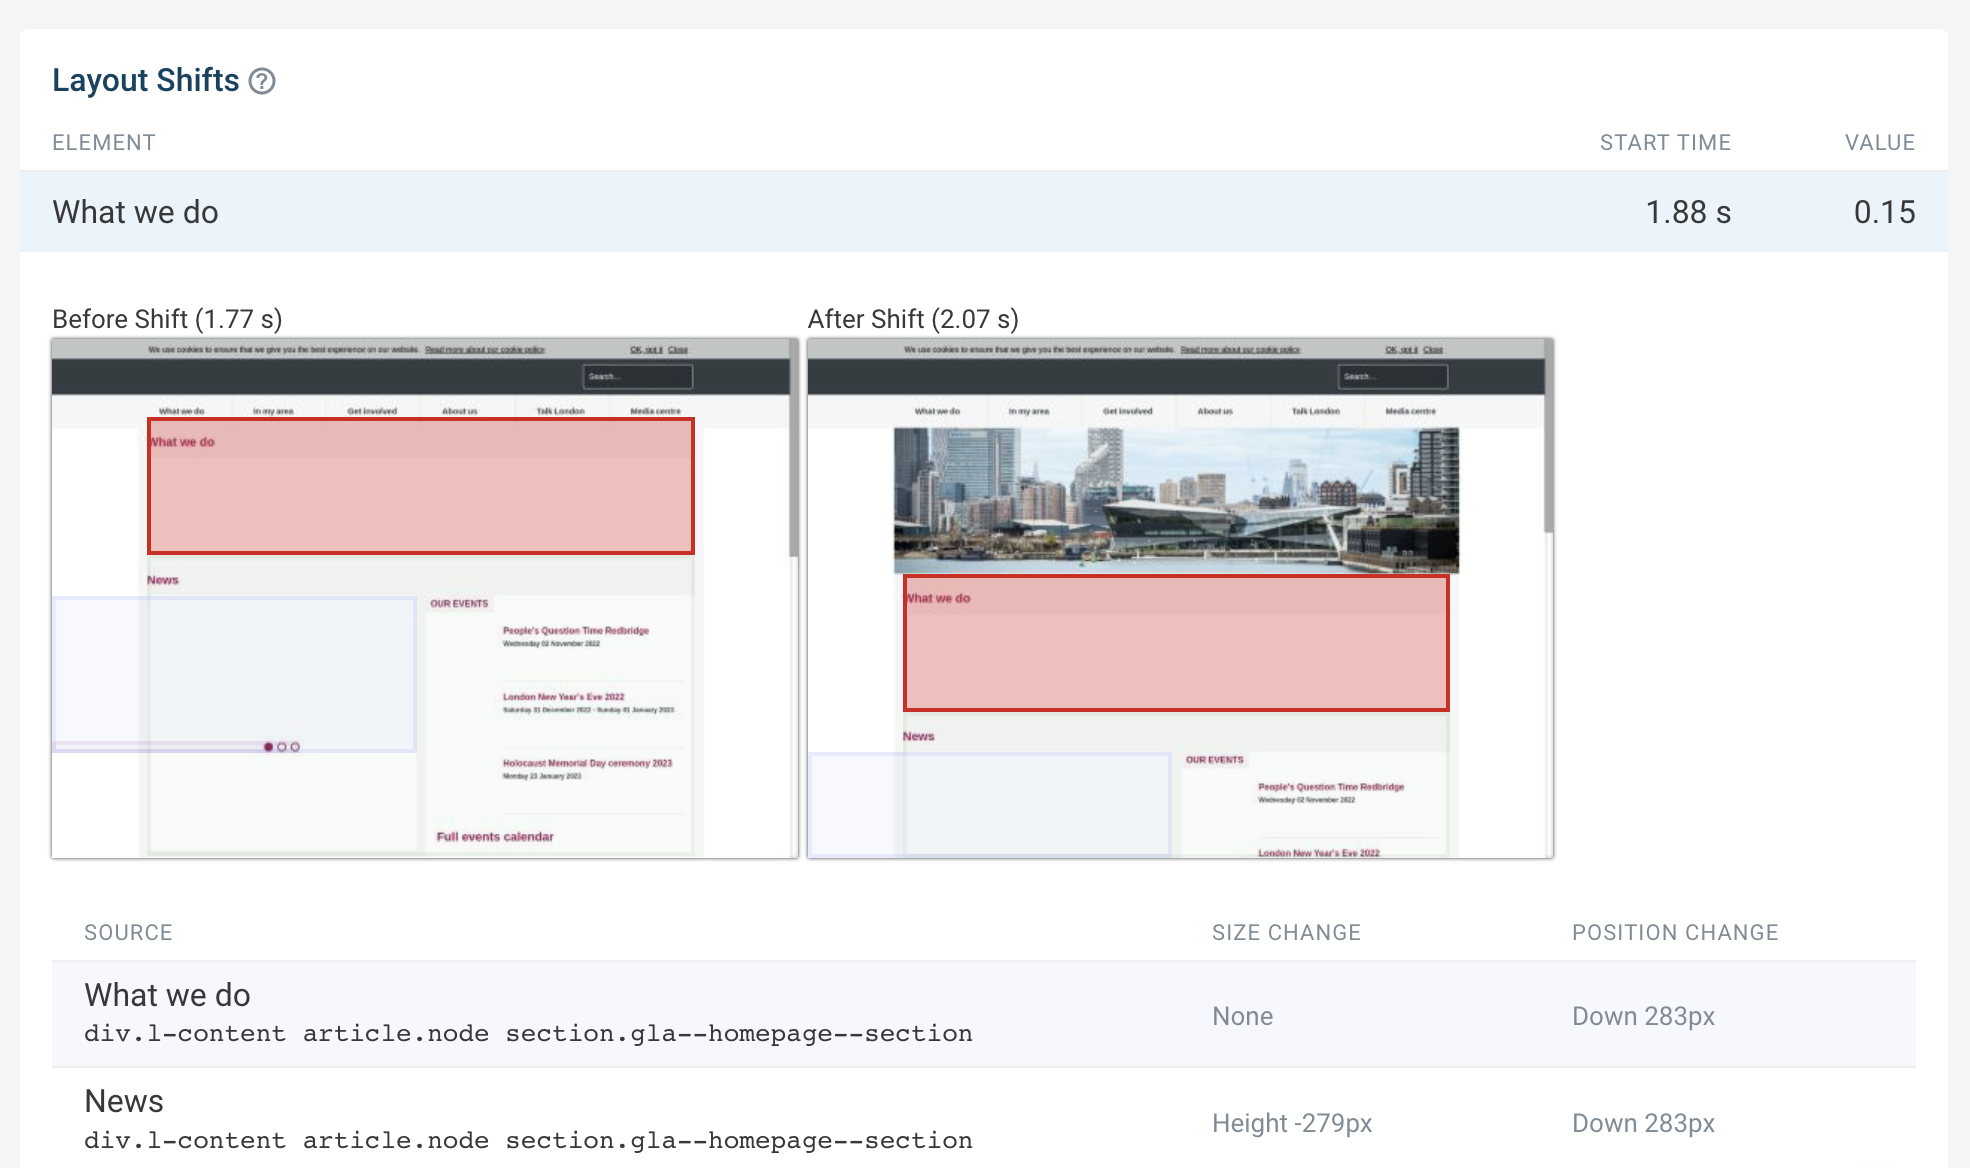 A before and after view of a layout shift in DebugBear, October 2022
How To Analyze First Input Delay Scores
First Input Delay measures how soon after a user interaction the page starts processing the user input.
Lab tests generally don’t simulate user interactions, but you can still look at long CPU tasks that would delay how quickly user input could be handled by the page.
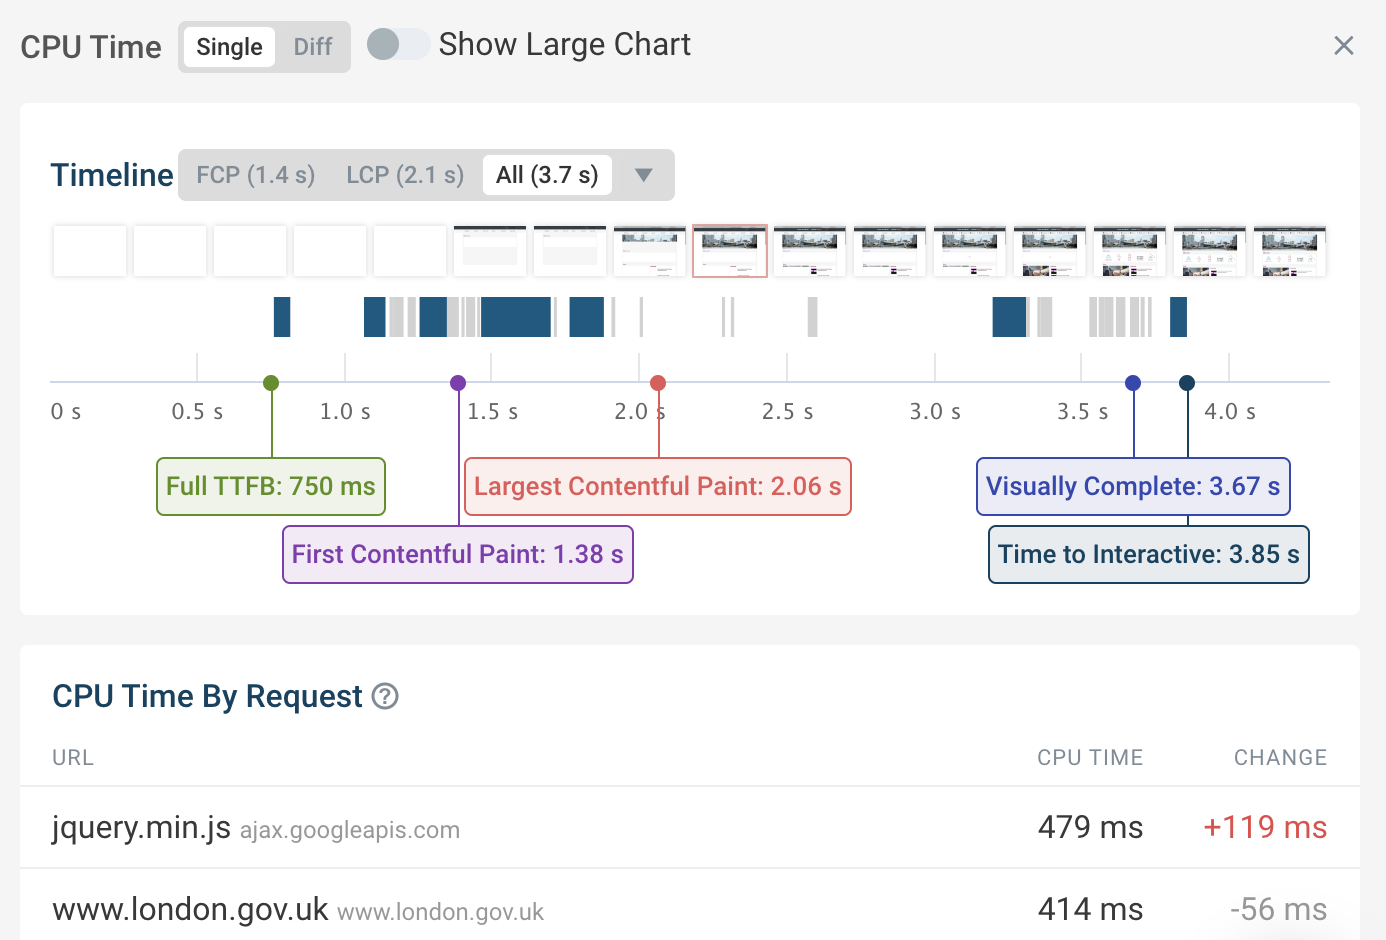 CPU processing during a page load in DebugBear, October 2022
Step 5: Identify The Most Promising Optimizations
The impact that different site speed optimizations have varies widely.
Often, applying a small number of improvements can drastically lift up your entire site.
Before implementing any changes, consider:
- How big will the impact be on the Core Web Vitals?
- Will the improvements apply just to a specific page or across the whole website?
- How much work will it be to implement the change?
Use Quick Experiments To Estimate The Potential Impact Of A Core Web Vitals Optimization
DebugBear includes an Experiments feature that lets you try out performance optimizations without having to make and deploy code changes to your website.
You can modify the page HTML to see how changes in resource prioritization would impact your website in practice.
For example, below we can see the early stages of the rendering process for a website. An image is eventually shown at the top of the page. The screenshot at the selected point in the rendering process shows what the page layout looks like before the image has loaded.
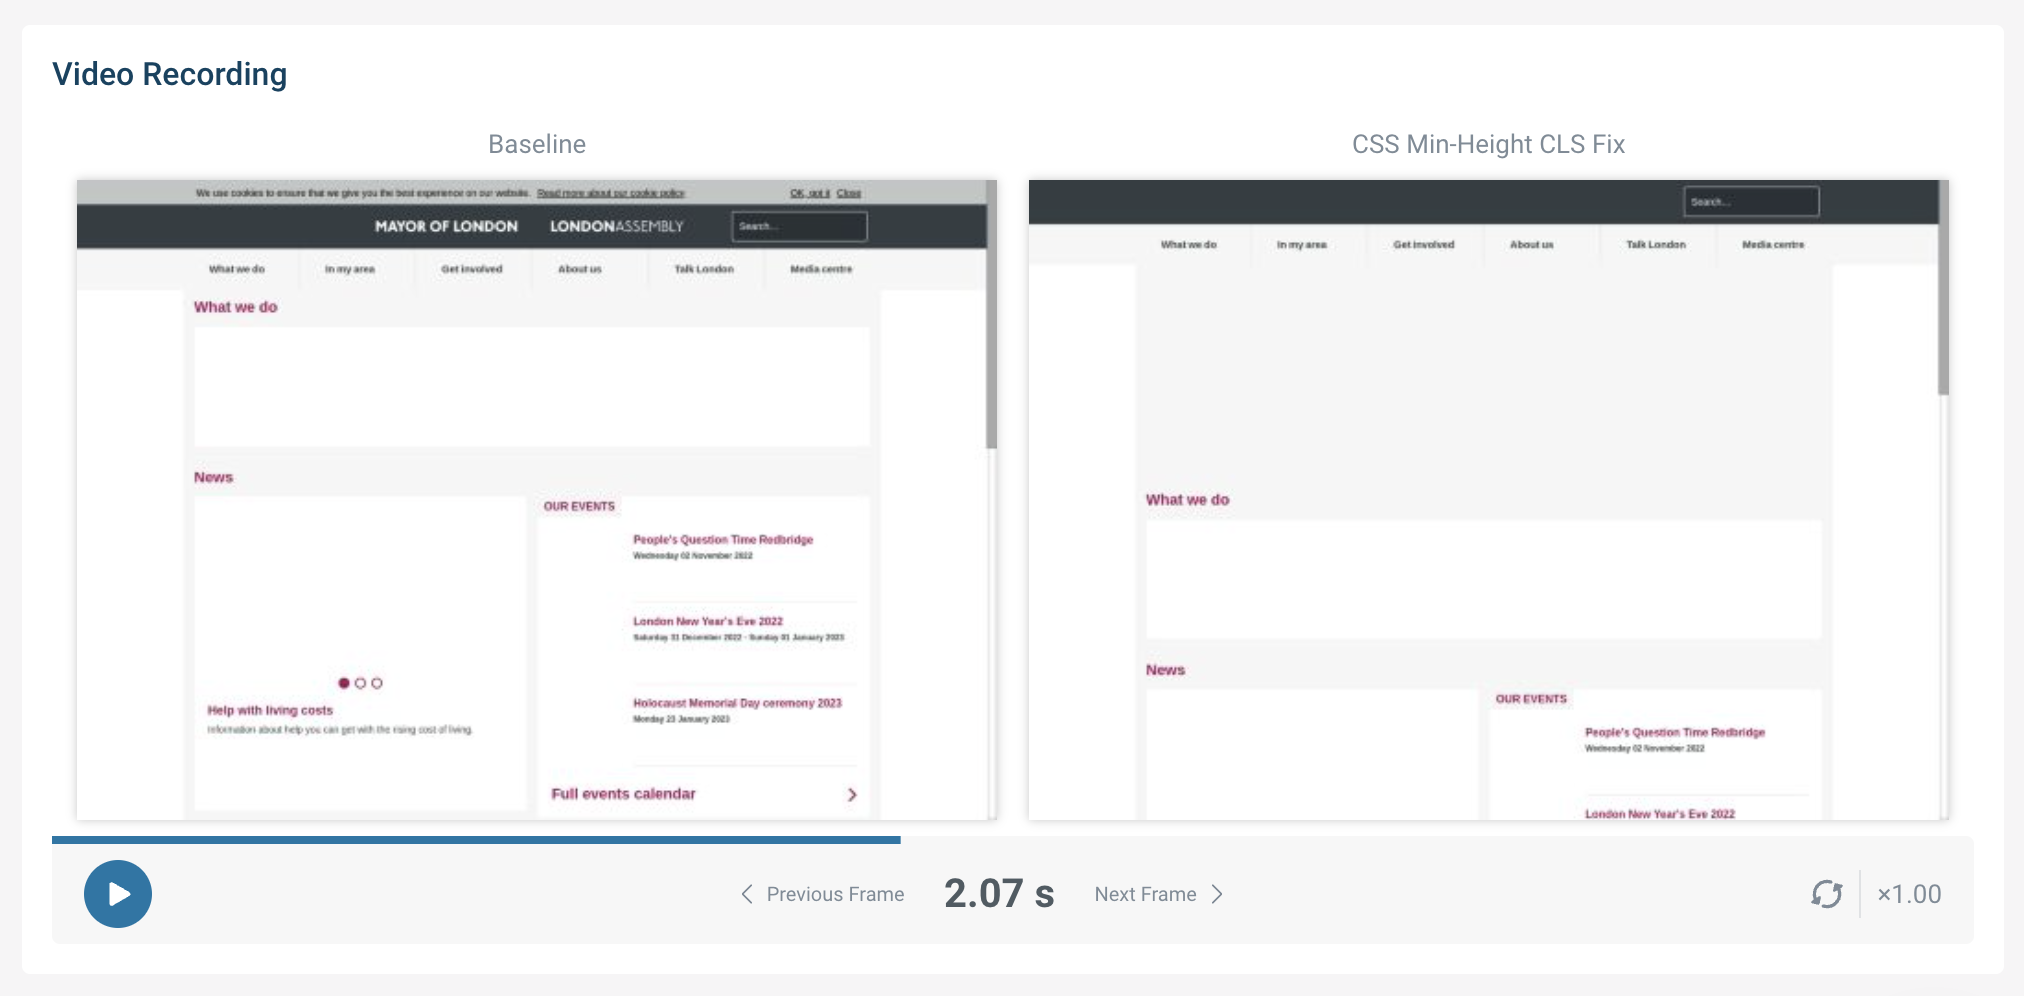 Screenshot of a site speed experiment in DebugBear, October 2022
In the baseline video recording on the left, no space is reserved for the image while the image file is being downloaded, resulting in an eventual downward shift of some of the page content when the image arrives.
On the right, we see an experiment to see how the page would load if a minimum height was set for the image, which eliminates the layout shift.
Use A Staging Environment To Test The Performance Impact Of A Core Web Vitals Optimization
Another way to check that your changes have the desired effect is by deploying code changes to a staging environment and running tests there.
Verifying metric improvements early will help you quickly find the changes that work and have a positive impact on Core Web Vitals.
Step 6: Evaluate Optimizations On Your Production Site
Once your changes are in production, or live, it will take 30 days to see the full result of your optimizations.
Once you can see the impact that your optimizations have had, you can go through these steps again to decide what to optimize next.
Start Optimizing Your Core Web Vitals For Better Performance
DebugBear can help improve your Core Web Vitals by making it easy to run performance tests, identify opportunities for improvement, and keep track of page speed over time.
The product is built for Core Web Vitals optimization, combining Google’s real user data with in-depth reports that help you make your website faster.
Try DebugBear with a free 14-day trial.
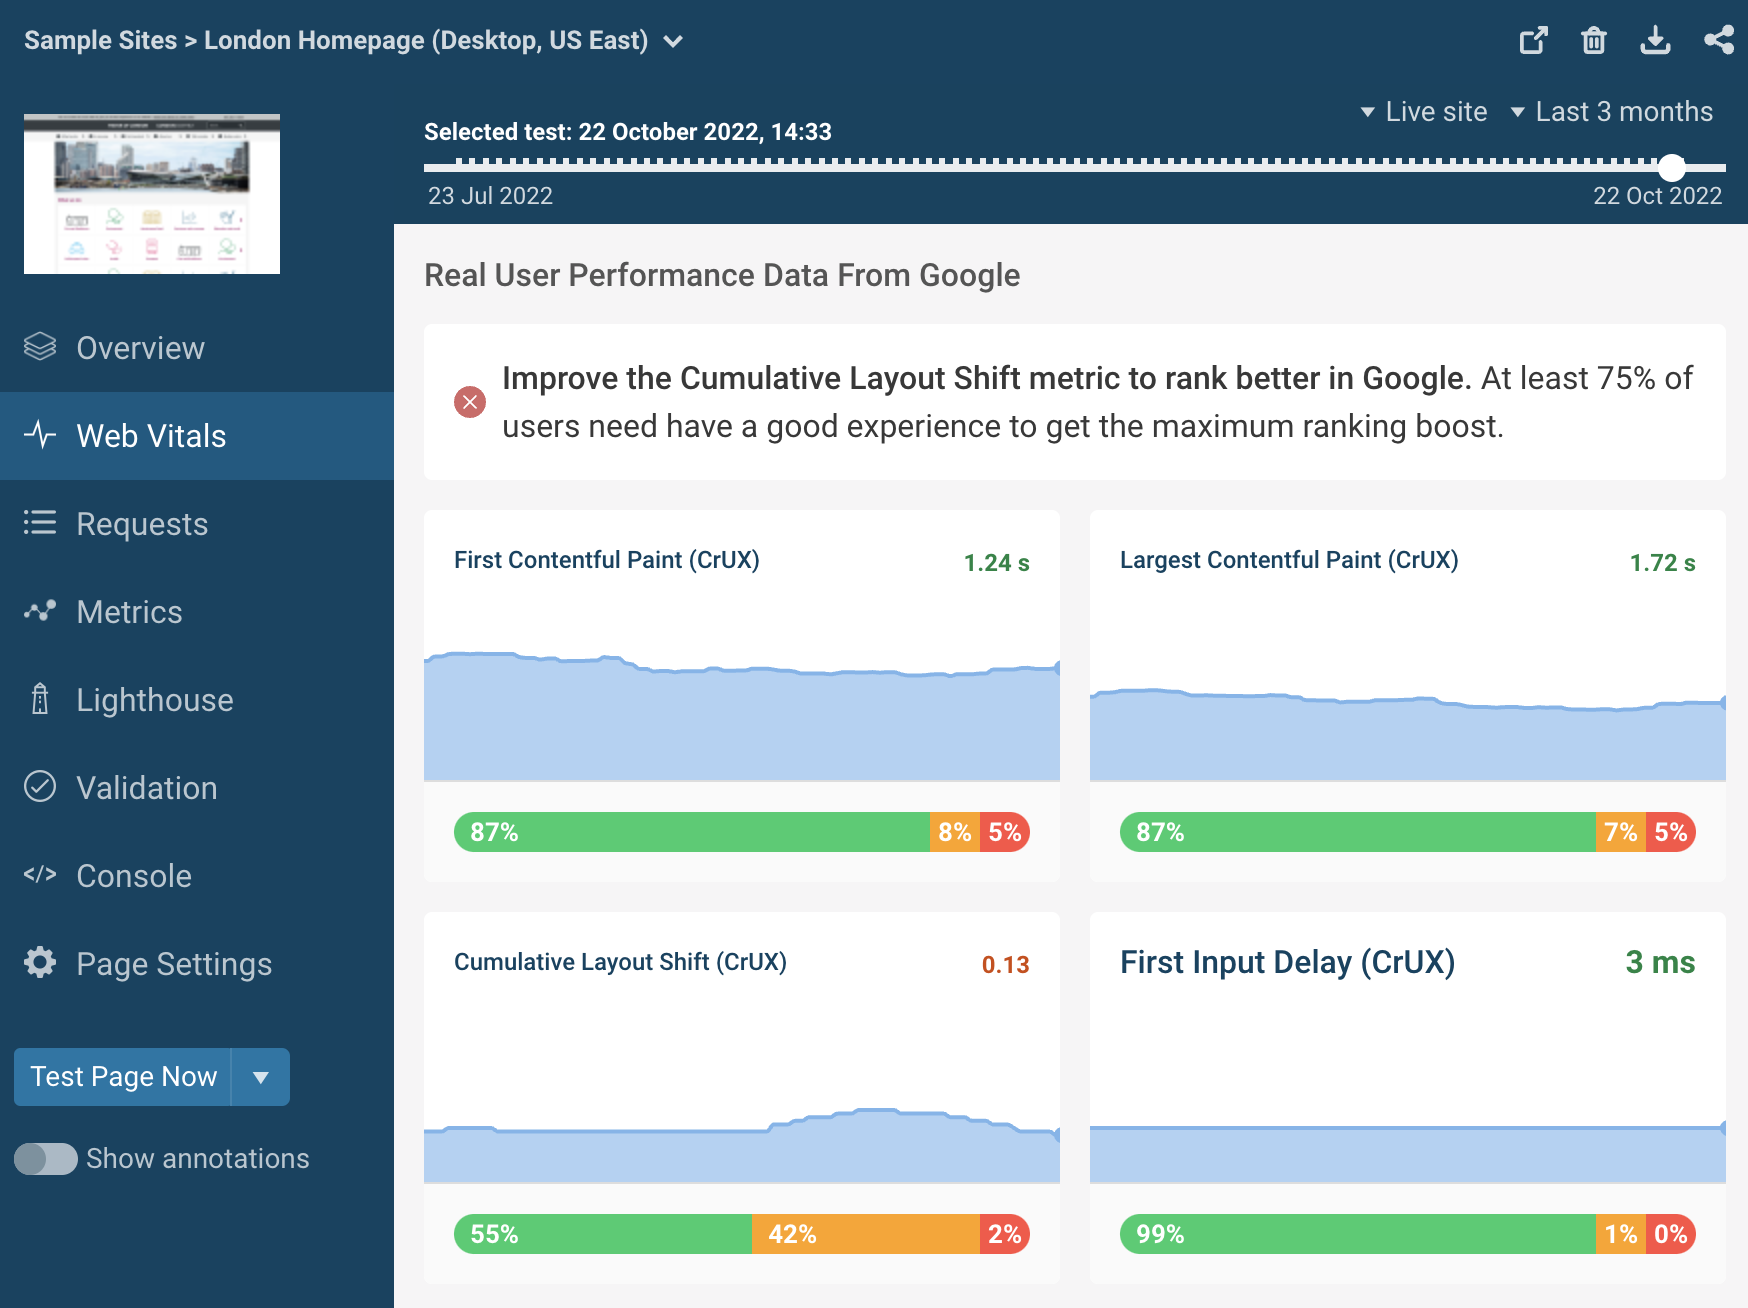 Core Web Vitals monitoring data in DebugBear, October 2022