Setting up and running a website or ecommerce project is great – however, your work is far from done once your site is up and running.
Without appropriate health and performance monitoring, your website will suffer the consequences – which can be far greater than simply slow load speed.
Let’s turn our attention to a hypothetical, ideal scenario where all the websites in the world are functioning as they should. Did you know that, aside from skyrocketing user satisfaction, we would also contribute to a better environment?
Poorly performing websites not only impact anyone who creates or uses them, but they also leave a larger carbon footprint.
According to the Website Carbon Calculator, websites have a carbon footprint, and the average website page emits 0.5 grams of carbon dioxide per view. That’s just the median.
When looking at the mean, which also considers high-polluting websites, that number goes up to 0.9 grams.
Aside from issues on a global scale, an unhealthy, inadequately-performing website will cost you time, money, and revenue. Website health is similar to our own: it’s easy to neglect and difficult to improve.
You need to be aware of the main components that make up website health to conduct appropriate monitoring practices to help save processing time.
With the emergence of quick and easy website builders, crafting websites has become accessible to everyone. All you need to do is sign up, choose a domain, pick your template, and voila! You have a website in seconds.
However, many website owners dismiss the fact that website creation is only the first step. Appropriate performance maintenance and health monitoring are also crucial.
And on that note, let’s look at some essential website health and performance indicators: what they are, how to monitor them, and how to make improvements.
Aspects To Monitor For A High Website Health Score
Core Web Vitals
 Image from author, October 2022
Google PageSpeed Insights
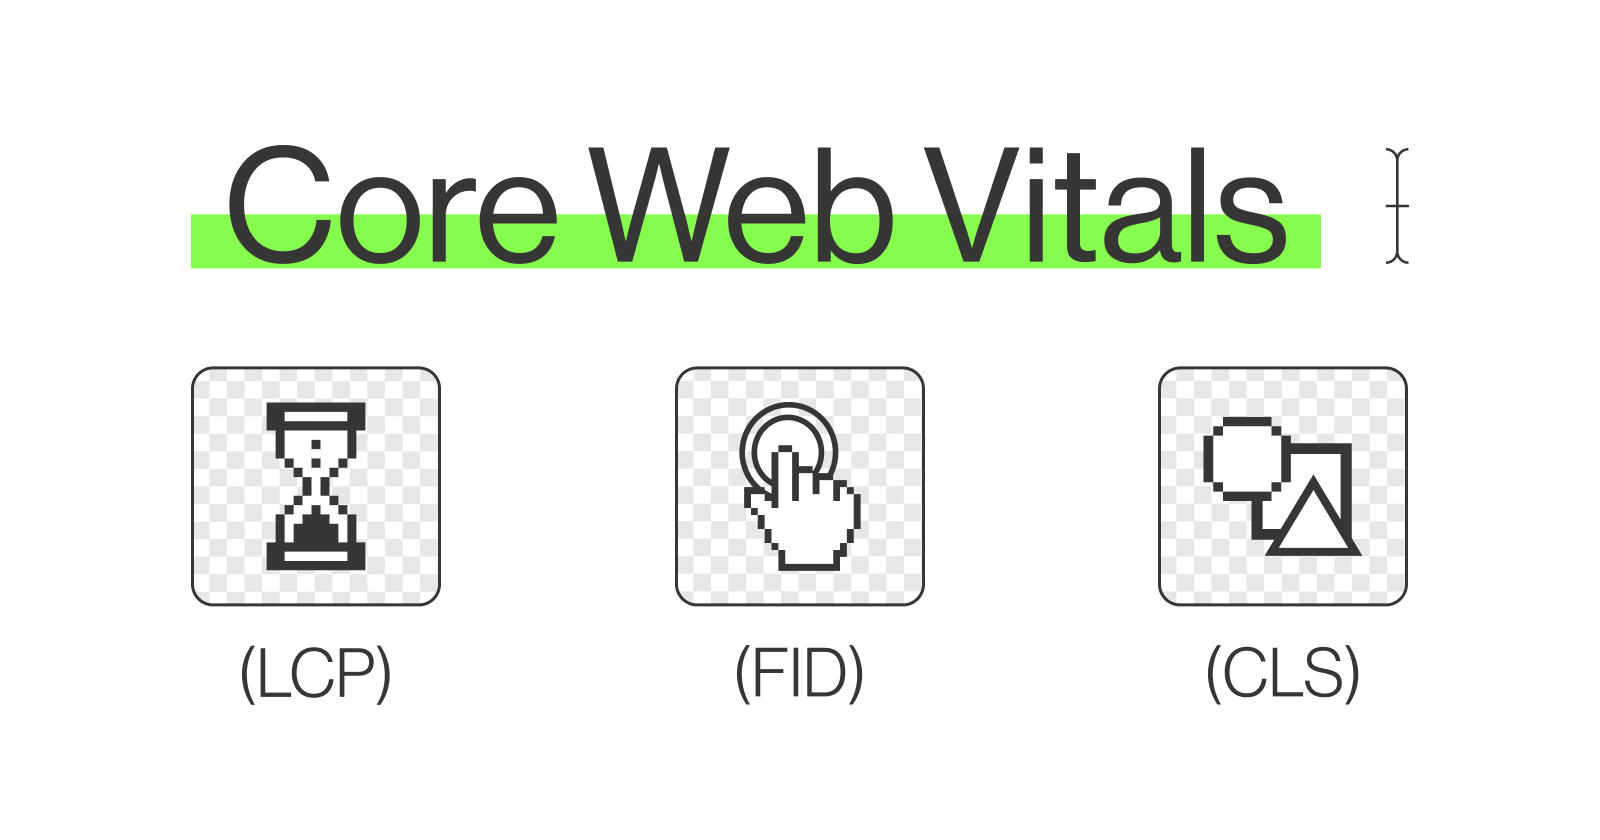
The first metrics you should consider when conducting performance testing are your Core Web Vitals. These performance indicators show speed, stability, and responsiveness, helping you understand the quality of your website user experience.
Several tools track your Core Web Vitals, but many website owners gravitate towards a simple tool: Google PageSpeed Insights.
After entering your URL into the tool, you will be presented with a report showing whether you passed your Core Web Vitals test and any other aspects you need to keep an eye on. Here are the three key metrics you will see:
Largest Contentful Paint (LCP)
Aim for a score of 2.5 seconds or less.
If your score is over 2.5 seconds, this could indicate the following: your server is lagging, resource load times are not up to par, you have high numbers of render-blocking JavaScript and CSS, or there is slow rendering on the client side.
First Input Delay (FID)
Aim for a score of 100 milliseconds or less.
If your score exceeds that time, you may need to reduce third-party code impact, reduce JavaScript execution time, minimize the main thread work, keep transfer sizes small, and request counts low.
Cumulative Layout Shift (CLS)
Aim for a score of 0.1 or less.
If your score exceeds this, you can avoid random layout shifts by including size attributes on your visual and video content (or reserve the space with CSS aspect ratio boxes). Avoid overlapping your content, and be mindful when animating your transitions.
Page Speed Blockers
Several factors can affect your website load speed. However, if you’re on a time budget and would like to focus on the main culprits first, pay close attention to the following factors:
- Unused JavaScript and CSS Code.
- Render blocking JavaScript and CSS Code.
- Unminified JavaScript and CSS Code.
- Large image file sizes (more on that below).
- Too many redirect chains.
In order to improve the load of JavaScript and CSS files, consider preloading them.
Another option would be enabling early hints, which tells the browser in the HTTP server response which resources it should start downloading by taking advantage of “server think-time,” thus speeding up the page load.
To test your website:
- Navigate to https://pagespeed.web.dev/
- Enter the URL of the page you want to scan.
I would recommend choosing your homepage first.
Another handy tool is WebPageTest.org, which also shows your Core Web Vitals and other metrics that can help you drastically improve your website performance and health. Also, it’s free!
Simply paste a page URL into the search box shown on the site, and it will conduct a full test from a default location.
You can also register as a user and choose from a list of locations to test your website from different countries, devices and browsers.
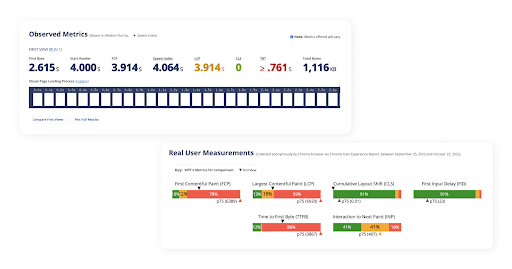
WebPageTest will show you exactly where your website is in terms of performance, and what could be slowing it down through a Performance Summary composed of four key sections: Opportunities and Experiments, Observed Metrics, Real User Measurements, and Individual Runs.
 Image from author, October 2022
At UCRAFT, we use a combination of tools such as PageSpeed Insights, Chrome Dev Tools, WebPageTest, and several others, to gain a clear understanding of what we need to work on when it comes to our website performance – especially since the SaaS industry is highly competitive already.
Design Elements
 Screenshot from author, October 2022
When we think about website performance and health monitoring, we usually leave these to the tech team to deal with.
But what if I told you how you design your website, and the elements you choose can make or break your performance?
That’s right – it’s time to get the design team involved.
Image Optimization
Images are great, but they can slow down your website if they are not sized appropriately. Make sure to resize your images, and avoid uploading giant files when they will not be shown in their entirety.
Likewise, compress your images and try out different file types like WebP, JPEG 2000, and JPEG XR instead of opting for heavier JPEG or PNG files.
Consider implementing native lazy loading to ensure that images are loaded when the user views them, instead of loading them all at once.
Almost all browsers, including Chrome, Safari, and Firefox, support loading=”lazy” attribute on <img> or <iframe>, which tells the browser to load them when the user scrolls closer to them.
Make sure not to lazy load above-the-fold images, as it will degrade the LCP score of your page, and Google recommends using fetchpriority=”high” attribute on images above the fold to improve LCP.
If you use that attribute, no need to preload the images. You should either preload or set “fetchpriority” attribute on images above the fold.
Also, take advantage responsiveness of the “srcset” attribute to load properly sized images based on the screen size, and avoid loading redundantly large images on small screens. This will greatly help to improve LCP score.
Fonts
Extravagant custom fonts are often challenging to read for users without 20/20 vision, but they can also considerably slow down your website.
Switch externally-hosted fonts for more web-safe fonts, and give Google fonts a try – as long as they are hosted through Google’s CDN.
Moreover, consider incorporating variable fonts into the general aesthetic of your website, since this font specification can significantly reduce font file sizes.
Make sure to preload your fonts.
Animations/Additional Features
This goes without saying: Don’t go overboard with animations, videos, special effects, sliders, or other fancy elements.
It’s nice to include some interactive elements here and there, but saturating your website with too many moving “things” can be frustrating for users and your servers alike.
Don’t use non-composited animations, as they cause re-painting of the page, which increases main-thread work – and the webpage may appear visually unstable when it loads.
PWA Solution For Mobile Optimization
Why not go the entire mobile-friendly route and turn your mobile site into a Progressive Web App (PWA)?
Since PWAs are built with service workers, they load cached content at a quicker rate. Not only that, but PWAs resemble native mobile apps, which is great for performance and UX.
Additional Technical Performance Metrics
Uptime
Uptime shows how well your website is functioning.
If your website crashes or is down frequently, it will harm your user experience, Google rankings, and, therefore, your revenue.
If possible, aim to have a 99.999% uptime and test your website from different locations.
Tools for uptime monitoring:
Database Performance
If you’ve checked the basics and your website is still slow to respond, it might be due to poor database performance.
You can check this by monitoring the response time for your queries and pinpointing the database queries that are taking up the most time.
Once you’ve done that, get optimizing! You can use tools such as Blackfire.io to help you easily identify bottlenecks and find solutions based on accurate data.
Web Server’s Hardware
Your website may lag if your disk space is packed with log files, images, videos, and database entries. Make sure to monitor your central processing unit (CPU) load regularly, especially after you’ve implemented updates or design changes.
Tools such as New Relic can help you improve your entire stack through efficient monitoring and debugging.
Search Visibility
A lot of the metrics discussed above already have a significant impact on search visibility.
So when you run your website pages through Google PageSpeed Insights and optimize them, you are also doing important things for your SEO.
You can also opt for website crawling tools such as Semrush or Sitechecker.pro, Screaming Frog, DeepCrawl, or any other tool that best suits your needs.
Website crawlers help find all types of issues, such as:
- Broken links.
- Broken images.
- Monitor core web vital metrics.
- Redirect chains.
- Structured data errors.
- Noindexed pages.
- Missing headings and meta descriptions.
- Mixed content.
Make sure you’re all set when it comes to the following points:
- XML sitemap – Ensure your sitemap is formatted correctly and check whether it’s necessary to make any updates and re-submit your sitemap via Google Search Console.
- Robots.txt – Ensure you utilize a robots.txt file for your web pages (HTML, PDF, or any other non-media formats that search engines can read) to manage crawl traffic better, especially if you suspect your server may be overwhelmed by requests from Google’s crawler.
Website Security And Caching
Get Your SSL Certificate!
A healthy website is a secure website.
Even if your website loads in perfect time and gets a 100/100 score, there is no way users (or search engines) are going to trust your site if it doesn’t start with https://.
An SSL certificate is essentially a code on your server that builds an encrypted connection, guaranteeing that user data remains secure.
Obtaining an SSL certificate is not a particularly difficult process, but it can be lengthy when done manually.
However, if you are using a well-established hosting provider such as BlueHost, more often than not, your provider will be able to issue a free SSL for your domain.
Consider Using A CDN
Content delivery networks (CDNs) are distributed servers working in unison to deliver fast internet content.
In other words, a CDN is a tool that speeds up the performance of your website by keeping its content on servers close to users, regardless of geographic location. This is also known as caching.
If you have a global presence, a CDN is a must! It will increase your page load speed, decrease your bandwidth costs, spread out your traffic (reducing the chances of your site going down), and increase security via features like DDoS mitigation.
Top players in the industry include Cloudflare, Amazon Cloudfront, and Google Cloud CDN. However, there are many other options, so do your research and pick the best CDN for your website and business requirements.
Setup Web Application Firewall
A Web Application Firewall (WAF) protects web applications by filtering out suspicious HTTP traffic. It is aimed at preventing applications from attacks such as:
- Cross-site forgery.
- Cross-site-scripting (XSS).
- File inclusion.
- SQL injection.
Below is a list of the most popular and trusted web application firewalls:
Or if you use WordPress, you can consider installing plugins such as:
Verdict
That’s a wrap! As you can tell, website performance and health depend on various aspects.
If your website is lagging, the first logical step is to check your Core Web Vitals and see what you can improve. You can also take a look at other technical metrics and improve on them.
SEO is also vital to your website’s health, so check your search visibility, links, and potential load blockers to see what you can improve on.
And don’t forget about your SSL certificate and caching, either.
Your website design can also impact your load speed and performance, especially if you or your designers are fond of using weighty design elements.
Remember to optimize your images, avoid heavy fonts, and use animations in moderation.
More resources:
Featured Image: JulsIst/Shutterstock
