
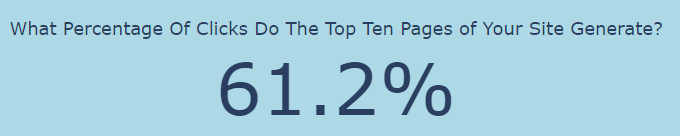
I recently discovered that 10 pages on our website accounted for over 61.2% of our total clicks reported in Google Search Console (GSC) in the last three months!
This is a site with around 300 categories and 20,000 product SKUs.
10 pages!
Just as shockingly, nearly 74.8% of all pages reported in GSC received no clicks at all.
Today, I will share a Python script that pulls this information from Google Search Console, exporting deck-ready graphs and a Microsoft Excel sheet ready for actioning.
-
 Screenshot from Google Colaboratory, August 2022
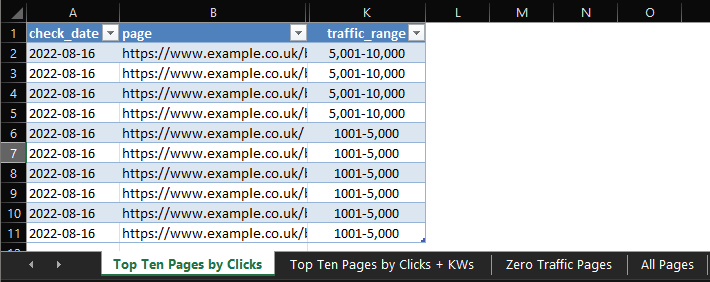
The Excel sheet is highly actionable, with high and low traffic ranges broken out into their own tabs for actioning.
-
 Screenshot from Microsoft Excel, August 2022
The output is fully automated and works for any account for which you have GSC access.
What We’ll Be Learning Today
- How to run the script.
- Key components and concepts of the script.
- Ideas for optimization.
Getting Started
Running the script is easy, but there is a small amount of preparation for setting up access to the Google Search Console API and downloading a credentials file.
The good news is that this file can be used again and again for other Python projects, so it’s worth doing and keeping it safe.
It should take no more than 5 to 10 minutes.
There is an excellent guide here I recommend following.
Once you have this file, store it in a safe place, ready to be uploaded.
Now the fun part: running the script!
Running The Script
Running the script is straightforward.
The idea is to run all cells simultaneously and upload the credentials file when prompted.
The script will automatically generate and save the bar charts, statistics, and Excel document with no further prompting.
Step 1: Open the Google Colaboratory sheet.
Step 2: At the top of the page, choose Runtime > Run All (Or Press the shortcut keys Control + F9).
Step 3: When prompted, upload the credentials file that was downloaded after enabling the Search Console API.
-
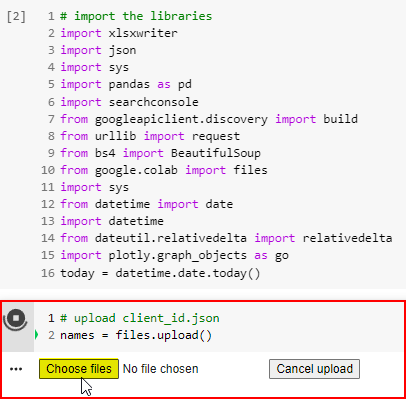 Screenshot from Google Colaboratory, August 2022
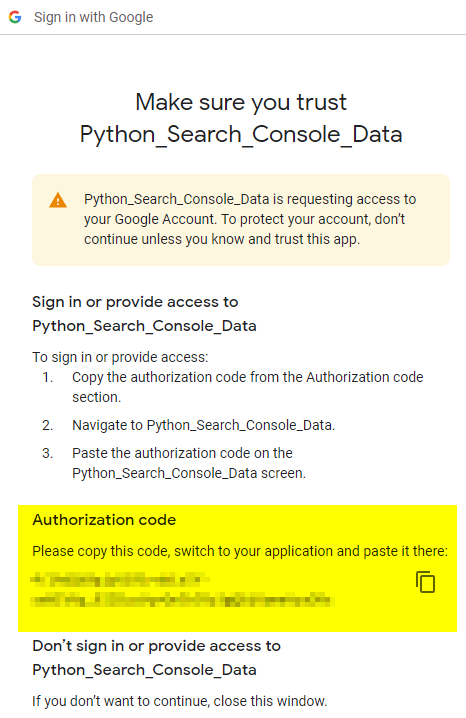
Once the file has been uploaded, the next cell will prompt you to visit a URL to authorize the application and enter the authorization code.
-
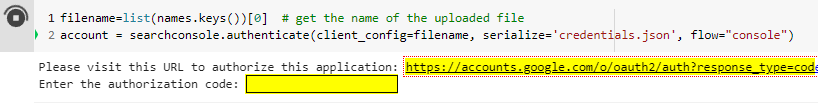 Screenshot from Google Colaboratory, August 2022
Click it and choose the account associated with the GSC account you wish to receive data from.
-
 Screenshot from Google.com, August 2022
Next, we need to set the variables.
It should be self-explanatory, but I’ll talk through each setting and share an example.
URL
The URL needs to match exactly how it appears in GSC.
If there are issues, it’s because it’s usually missing a trailing slash!
Also of note, for domain-level accounts, the syntax is:
sc-domain:example.com
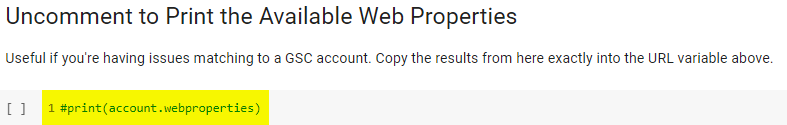
I have included an option to print the available GSC accounts if you have issues.
-
 Screenshot from Google Colaboratory, August 2022
Just uncomment the line:
#print(account.webproperties)
… to see the list of available accounts at your disposal.
Copy and paste the account name exactly into the cell above.
Country Filter
A simple variable to filter traffic by country. To set worldwide, simply comment to this line:
df_gsc = df_gsc[df_gsc[“country”].str.contains(country_filter)] # comment this line for worldwide data
Search Type
Available options here are web, news, video, image, discover & GoogleNews.
Start/End Date
Enter the start and end dates for which to pull GSC data. I recommend at least three months if possible. The date format is:
YYYY-MM-DD
Here are my settings to pull the last three months of data from the GSC property for Search Engine Journal.
url = “https://www.searchenginejournal.com/”
country_filter = “usa”
search_type = “web” # available options are: web, news, video, image, discover & googleNews
start_date = “2022-05-01”
end_date = “2022-08-01”
The data will be pulled from GSC. That may take a while, depending on the size of the site and the number of months requested.
Once the data pull has been completed, the next cell will create the dataframe from the GSC data.
The first 10 rows will be previewed, so you can check the data is correct.
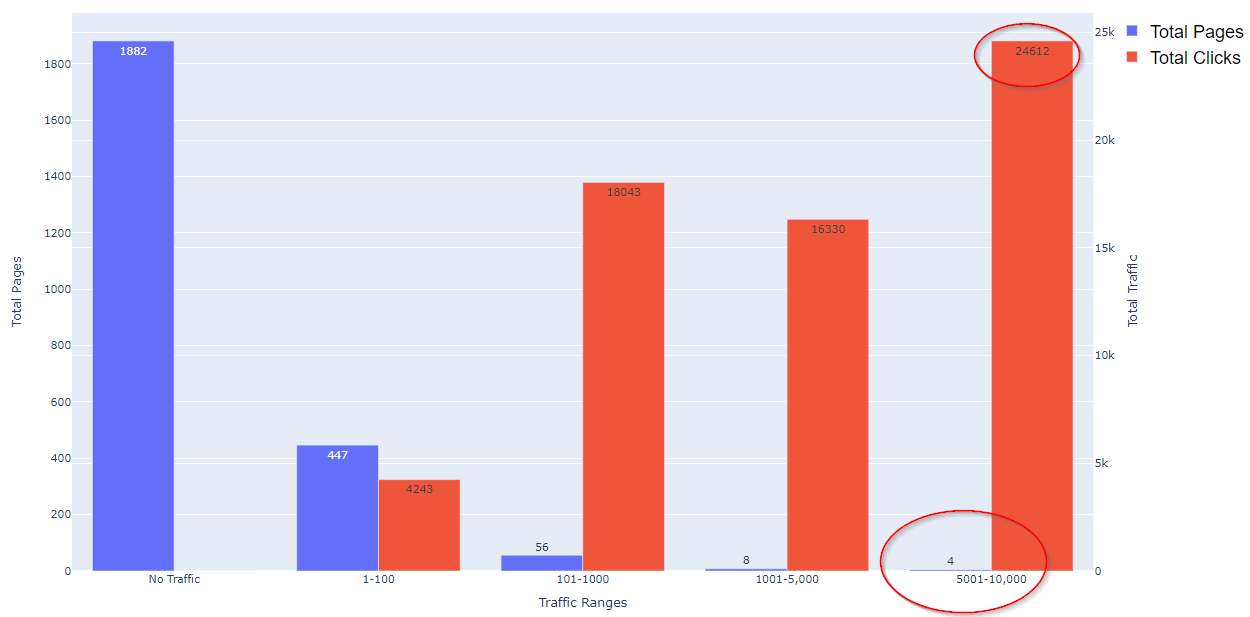
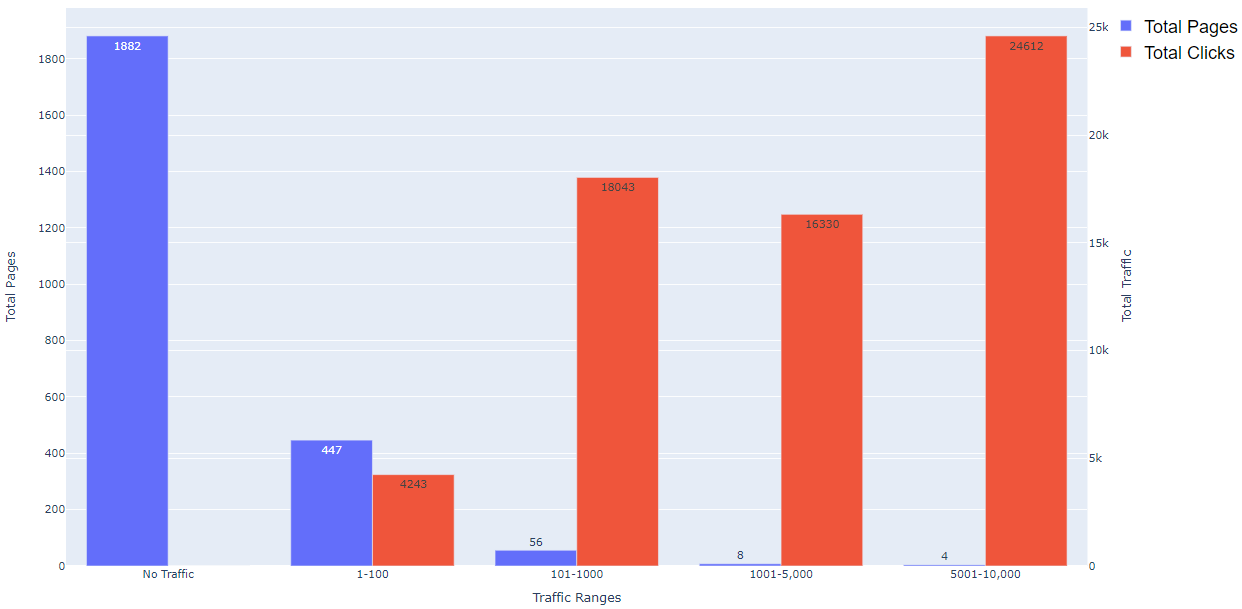
Scrolling down the page, you will notice a bar chart has been created.
This chart groups pages into ranges according to the number of clicks attributed to them.
This makes it easy to see click distribution of clicks between pages at a glance.
-
 Screenshot from Google Colaboratory, August 2022
The bar chart can be copied into presentations as required and usually tells a powerful story with the data.
In testing, I have found that most sites exhibit the same kind of traffic breakdown.
Knowing which pages are responsible for a high percentage of traffic makes it easy to prioritize tasks for optimization.
Just below the bar chart, some statistics are created and displayed.
- The percentage of pages in GSC with no clicks.
- The percentage of clicks the top 10 pages in GSC generated.
 Screenshot from Google Colaboratory, August 2022
-
 Screenshot from Google Colaboratory, August 2022
Finally, a Microsoft Excel document is saved for actioning.
This document contains everything you need to create an action plan to optimize pages at the top end and the low end of the scale.
How Can This Data Be Used?
There are many creative ways these insights can be turned into actions.
Top Pages
Check The Appearance Of Each Page In The SERPs
- Is relevant Schema triggering correctly?
- Are page titles/meta descriptions truncated?
- Are page titles/meta descriptions missing keywords?
- Could page titles/meta descriptions be improved with better messaging, additional keywords, better CTAs, etc.?
- Are the correct sitelinks triggering?
Conversion Rate Optimisation
- Pages with high traffic are ideal candidates for A/B testing – get statistically significant data faster!
- Review and refresh content.
Analysis
Pages With Zero Traffic
Review Pages In Search Console
- Review Discovered Not Indexed/Crawled Not Indexed for technical blockers.
- Are pages in sitemaps?
Content
- Review content. Is content thin or lacking?
- Is there any pattern to the pages which receive no traffic?
Conclusion
These are just a few ideas of how someone could take action using the data, but I’m sure there are a lot more approaches that could be taken.
More resources:
Featured Image: CG_dmitriy/Shutterstock