
Hello, my fellow search industry friends. It’s already November 2021, which means if you haven’t done it already, you’re behind schedule on planning for 2022.
I recognize most of us have still not recovered from the dumpster fire that was 2020 (just look at my beloved NY Jets as an example).
But 2020 left us one more little PITA Easter egg, too: The inability to truly use historical annual data from last year to plan for 2021 or 2022.
Take a deep breath and accept that you’re already way behind the 8-ball here. Let’s discuss how you’re going to do this.
How Strategic Planning Typically Goes In Search Marketing
First, an important note: This process applies if you’re working toward the same game plan as the prior year, without dramatic sweeping changes.
What this doesn’t apply to is if you’re moving from a lead generation to an awareness approach.
The most common way new year search planning goes is by examining historical data. Here, you examine YoY growth in costs per click (because let’s be honest, it rarely ever goes down).
Advertisement
Continue Reading Below
All of this is done by the engine, so you end up with behavior for Google Ads, Bing Ads, and (for some advertisers) even Yelp.
You examine seasonal, monthly, even day-of-week behavior across all your campaign segments including PLAs, brand, non-brand, high volume, etc.
Once this is done, you look for front and back end traffic variances over the past 2-3 years.
You’re looking for highs or lows caused by time or macro factors that often repeat annually, or are a one-and-done scenario.
You’re probably keeping a close eye on impression share data (especially impression share lost).
Then you apply expected growth, increase in spend, etc., across 365 days, flexing up or down for recurring seasonal, quarterly, monthly, weekly, or daily events.
And BOOM!
You’ve got your anticipated needs and delivery for 2022 all put together in a nice neat little package.
That worked pretty well – until 2020 came along.
What Made 2020 A Planning Nightmare For SEM Pros?
Well, if you’re wondering that, you either have a unique and different form of planning, you lived in a shack without the internet off the grid, or you’re only a year deep into the industry.
Advertisement
Continue Reading Below
These are all acceptable answers.
More than one factor played into the chaos of 202 in a big way:
- The pandemic: This totally eliminated some verticals (i.e. travel), crushed others (i.e. retail banking), and was a “golden age” for others, such as direct-to-consumer consumables and home improvement.
- Election season: This hit some verticals a lot more than others as politicians ran ads that targeted key terms in adjacent/halo categories such as Medicare/insurance, healthcare, and law.
- Unemployment: Rising unemployment impacts verticals differently. You often see longer purchase cycles, higher price points, and luxury goods taking an ugly hit.
Planning SEM For 2022, Step By Step
So, what are you supposed to do now?
Well, the number one thing is to take this seriously but avoid panic.
Depending on your vertical, your activity may have returned to pre-pandemic levels of normalcy.
For those who have seen a return to “normal,” this will be a bit easier.
Here’s what you’re going to do, provided you are keeping the same objectives.
1. Pull January-September data.
2. If you lost impression share due to budget…
Identify which campaigns, and months, and determine the opportunity if you weren’t underfunded (fun little equation below).
-
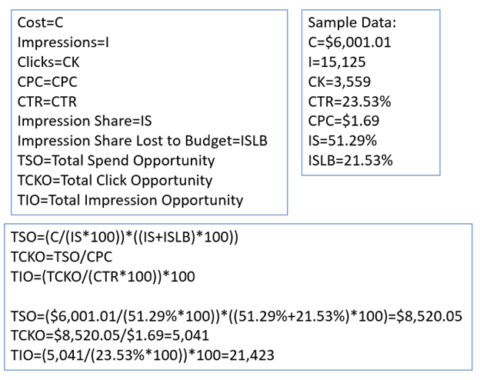 Calculation Of Actual Impression Share Data for Budget by author, November 2021
3. Take it further.
Now if you want to take it a step further, you can calculate the missed opportunity due to missed impression share due to rank.
I first learned about this formula in PPC Math Made Easy by Rachel Law in 2019, and find it pretty accurate.
-
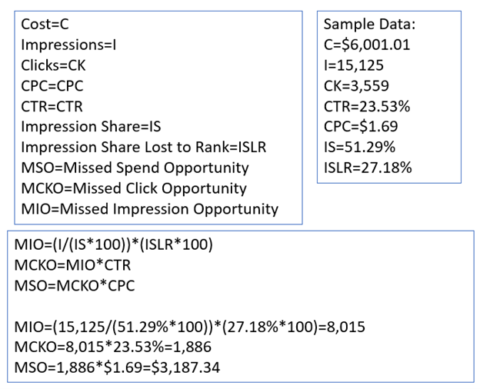 Calculation Of Actual Impression Share Data for Rank by author, November 2021
4. Add total opportunity if you were underfunded to missed opportunity due to rank.
You got what you should’ve had for this year.
Advertisement
Continue Reading Below
5. Look back at average CPC growth for the past 2-3 years by month.
Apply that growth to your CPC and cost (not impressions or clicks though).
I had a habit of annual growth of 3%-5%.
6. Review the prior 2018 and 2019 Q4 growth/activity change.
Compare against Q3 and apply that demand/CPC/traffic, etc. to your current Q4 budget and forecast.
Boom, you have a plan for 2022 that is filtered for our election season, unemployment, and pandemic noise.
Tips for SEM Planning In Specific Scenarios
Now, that is all well and good unless you are handling one of the verticals that took a hammering or had a golden age.
Your process will be similar, but not entirely the same.
If your performance has not reset, or at least trended back to pre-pandemic levels in the past 3 months, follow this approach – and remember, this is for advertisers keeping the same objectives.
If your geo-target is anywhere outside of Asia/Oceania regions…
Start by pulling 12 months of historical data for February 2019 to January 2020. This is as recent as you can realistically get before things really hit the fan for most of the world.
Advertisement
Continue Reading Below
If you are operating ads targeting Asia/Oceania, then pull data for November 2018 to October 2019.
Determine total opportunity that should’ve been with Impression Share Lost.
Then scale CPC for 2 years.
This is based on historical 2-3 year growth (ending at the last month you pulled), including Q4.
Note: If you’re doing 3%-5% annual growth, be sure to scale for year-on-year (i.e. a compounded 5% CPC for 2 years comes out to a 10.25% growth rate).
Now for the important part – flexing based on macro factors, including:
- Supply chain limitations: Reduce by product until you can forecast proper delivery.
- Abnormal lift as a halo from the pandemic (i.e. DIY products): Start with a low-end budget and have a test reserve as more consumers are returning back to regular life.
- COVID impacted sales (i.e. gym memberships): Plan for a median demand between regular and peak seasons.
- Major holiday seller: Shorten for 2022, assuming holiday shopping starts in mid-November instead of October, but reserve emergency budget in case.
The list of factors goes on, but the reality is that you need to account for the fact that your extreme downturn (out of character, that is) or upturn is based on a macro factor, and unpredictably it will eventually revert.
This means you need to play on the conservative side with budgeting, and put excess/surplus in a reserve test budget.
Advertisement
Continue Reading Below
Once I Have My Traffic Numbers, What Should I Do Now?
Well, you could do nothing. But that would be a terrible idea.
Instead, apply historically normalized (follow data history from above to find “normalized”) post-click performance data such as conversion rate (CVR), cost per acquisition (CPA), etc. to your delivery numbers. This will give you your expected back-end performance for the year.
But remember to exercise caution here.
Your extreme windfall in positive performance could be just temporary, so don’t use COVID numbers to predict positive performance. At the same time, if you had a downturn, use that data and hope it turns positive.
If there’s only one thing you take away from this column, I hope it is that 2022 is the year of airing on the side of caution.
Do this, and you’ll either meet your forecasts or blow right past them.
And cross your fingers that the murder wasps don’t try to make a comeback.
Advertisement
Continue Reading Below
More resources:
Featured image: Shutterstock/N ON NE ON