
This post was sponsored by DebugBear. The opinions expressed in this article are the sponsor’s own.
Do you want to improve your website’s performance?
While there are tools to track performance metrics, many are lacking the features you need to accurately collect and utilize your website’s performance data.
So, let’s learn more about the key performance metrics you need to analyze to keep your website running at peak performance and help improve your rankings.
You’ll also find out how DebugBear can help you track historical changes, see the effects of changes to your website’s performance immediately, and get additional insights beyond what Google has to offer.
What Are Core Web Vitals?
Core Web Vitals (CWV) are performance metrics that use real user experience data to measure the speed, responsiveness, and visual stability of your website.
The following three metrics make up your website’s Core Web Vitals:
- Largest Contentful Paint (LCP) – This measures the time it takes to initially load the largest portion of the main content on a web page.
- First Input Delay (FID) – This measures the time it takes the browser to start processing the first interaction a user makes with your website, such as clicking on a link or tapping on a button.
- Cumulative Layout Shift (CLS) – This measures unexpected layout shifts that occur during the entire lifespan of a page.
To meet Core Web Vitals, your webpage must have an LCP within 2.5 seconds, FID of 100 milliseconds or less, and a CLS score of 0.1 or less.
Why Core Web Vitals Matter
In 2020, Google announced that page experience signals, as a whole, would become a part of Google Search ranking factors.
After it was launched, Google’s John Mueller confirmed that it was more than just a “tie-breaker” metric.
“It is a ranking factor, and it’s more than a tie-breaker, but it also doesn’t replace relevance.
Depending on the sites you work on, you might notice it more, or you might notice it less.
As an SEO, a part of your role is to take all of the possible optimizations and figure out which ones are worth spending time on.
Any SEO tool will spit out 10s or 100s of ‘recommendations,’ most of those are going to be irrelevant to your site’s visibility in search.
Finding the items that make sense to work on takes experience.”
Further, in a Core Web Vitals Q&A, Mueller states that Core Web Vitals are not binary.
You may see ranking improvements as a website moves just from “needs improvement” to “good” in LCP, FID, and/or CLS.
Uncover What’s Missing From Your CWV Data
Google offers three ways to track your website’s Core Web Vitals:
- The Search Console Core Web Vitals report.
- The Chrome User Experience Report.
- PageSpeed Insights.
These tools can give you some insight into your website’s performance.
On their own, they each have inherent flaws that can make it difficult to accurately track the user experience data you really want.
In short, if you’re using only Google’s native tools for CWV troubleshooting, you may be missing key information that helps you drill down and make effective improvements to your website.
What’s Missing From Google Search Console?
Google Search Console doesn’t show Core Web Vitals issues by individual URL right out of the gate.
Instead, it shows issues by groups of URLs.
This makes it difficult to drill down to specific pages that require change.
The reason, according to Search Console Help, is as follows:
“The report is not designed to find the status of a specific URL, but rather to see your site’s performance as a whole, and troubleshoot issues affecting multiple pages on your site.
If you want to see performance data about a specific URL, use an external test. Although you can drill down on status and issue and see specific affected URLs, finding a given URL using the Core Web Vitals report can be challenging.”
What’s Missing From The Chrome User Experience Report?
Metrics provided by the Chrome User Experience Report don’t give insights for specific URLs either.
“Site owners that want more detailed (URL level resolution) analysis and insight into their site performance and can use the same APIs to gather detailed real user measurement (RUM) data for their own origins.”
What’s Missing From The Pagespeed Insights Tool?
The Pagespeed Insights Tool offers both field and lab data for your website’s core web vitals.
Field data represents your actual user’s experience over the last 28 days.
Lab data is collected in a controlled environment with predefined settings for the devices and network.
With two different sources of data, which one is the one you should trust to better optimize your website’s performance?
How To Accurately Measure Your Core Web Vitals Data
For a more detailed analysis and clear understanding of your Core Web Vitals, Google recommends:
- Using external tools to break down and compile CWV data in a way that’s meaningful for you.
- Knowledge of API connectivity to create a personally customized tool.
It is clear that Google’s tools provide the framework for data collection.
DebugBear takes care of laying out the data you need in a way that helps you improve your website.
How DebugBear Provides Better Core Web Vitals Monitoring
DebugBear has several Core Web Vitals monitoring features that SEO professionals and developers can use to identify the pages that need performance optimization the most.
1. Track Historical Changes To Understand What Changes Are Working
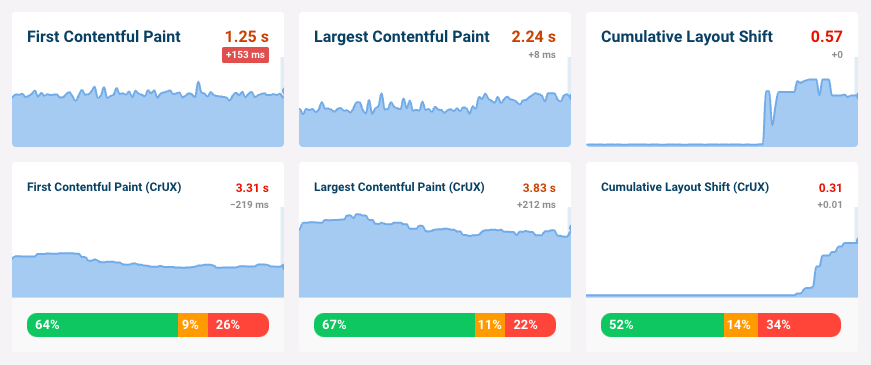
DebugBear will keep track of historical changes to your Core Web Vitals in the Chrome User Experience Report (CrUX).
This will allow you to see your slowest URLs with long-term performance trends.
 Screenshot of site speed trends in DebugBear, March 2022
2. Set Up Daily Google Lighthouse Tests & See How Changes Affect Your Performance Metrics Today
DebugBear tests your website with Google Lighthouse daily.
This means you don’t have to wait 28 days after making a change to see how it will affect your performance metrics.
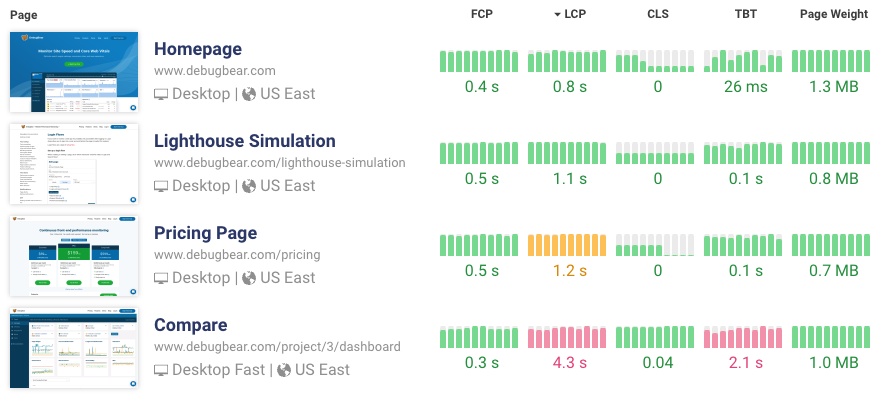
3. Drill Down On Website Performance By Region
Want to know how your website performs in a specific region?
DebugBear lets you choose your testing location from over ten global locations, as opposed to PageSpeed Insights three servers from North America, Europe, or Asia.
4. Make Sure Your Developers Are Seeing All Key Performance Optimization Insights
DebugBear also runs on top of Google Lighthouse, collecting additional data about your website’s Core Web Vitals and overall performance.
These insights are designed to give developers the data they need to make key performance optimizations that can make a major impact on metrics and rankings.
 Screenshot of Core Web Vitals in DebugBear, March 2022
Sign Up For A Free Trial
Want to understand your website’s performance and the Core Web Vitals that may be affecting your ability to outrank your competitors?
Learn more about DebugBear’s Core Web Vitals monitoring service or sign up for a free 14 day trial to see how it works for yourself.
Image Credits
Featured Image: Image by DebugBear. Used with permission.