If you are familiar with Google Analytics 4 (GA4), you probably know already that it has built-in scroll tracking by default.
And naturally, you might be asking yourself: why do I need custom tracking for scroll depth?
The GA4’s “built-in scroll event” triggers when a user has scrolled through approximately 90% of the page – but you most likely want to know more than that, such as how many users scrolled through 50% or even 25% of the page.
Here is why you would need to set up custom scroll depth tracking in GA4.
By tracking scroll depth, you can gain insights into user engagement and behavior, understand how much content users are consuming, and optimize accordingly.
We will be looking into implementation by using Google Tag Manager (GTM).
Overall, I would highly recommend using GTM for your GA4 setup vs. gtag.js because it has very nifty features you can use and requires less time to maintain the setup.
At least you can go hybrid and use GTM with the datalayer.push method whenever you need more granular control over tracking.
We will learn how to set up scroll depth tracking and build an example content engagement dashboard in Looker Studio.
How To Set Up Scroll Depth Tracking
First of all, we have to disable default scroll tracking from the Enhanced measurement stream.
Navigate to Data Stream > Clicks to Stream.
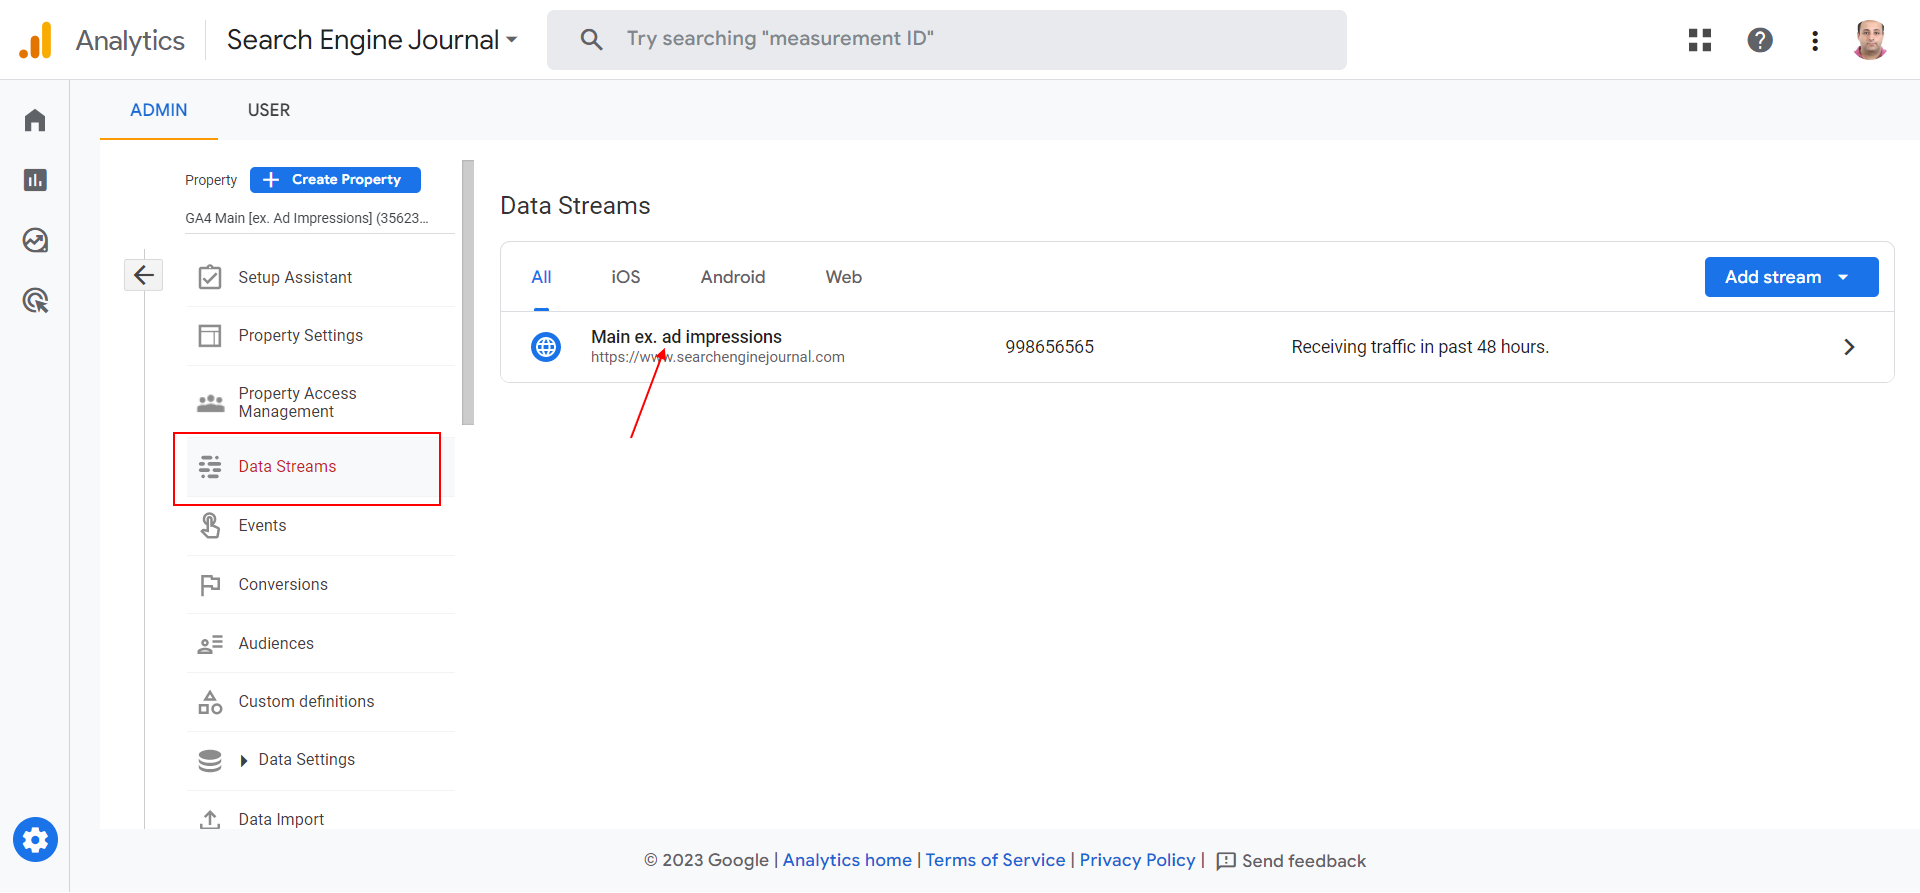
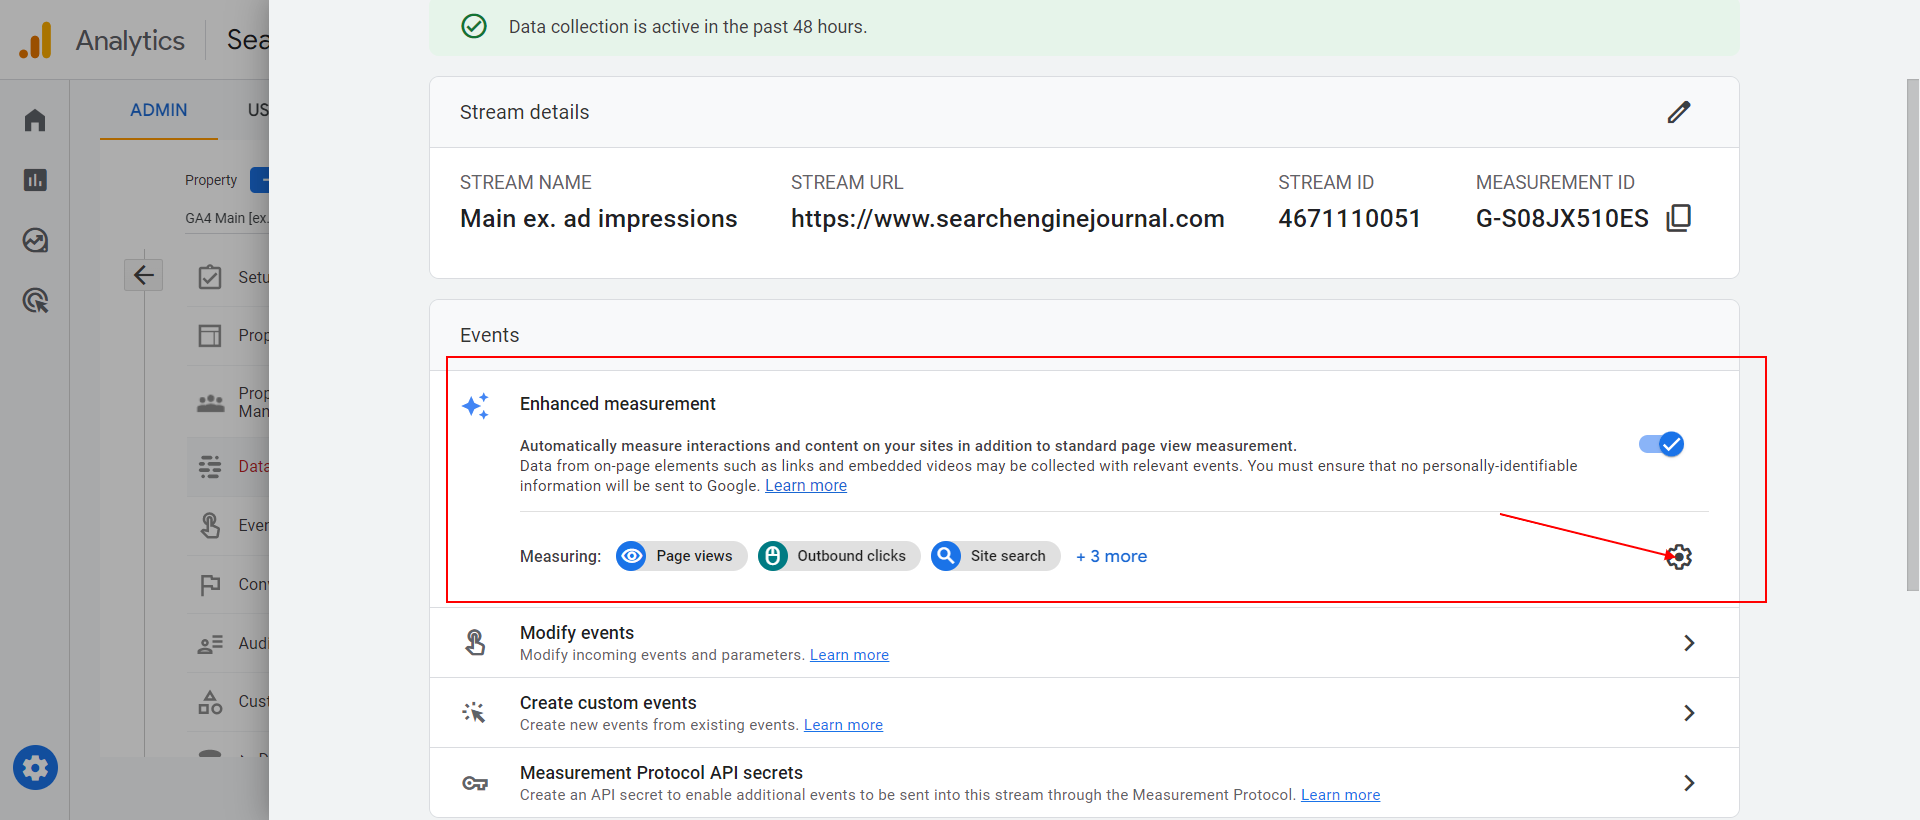 Enhanced measurements.
Disable scroll tracking in the popup dialog.
Navigate to GA4’s custom definitions setting page and add the custom dimension “scroll_percentage” (you can name it anything). We will be using this to send scroll depth thresholds.
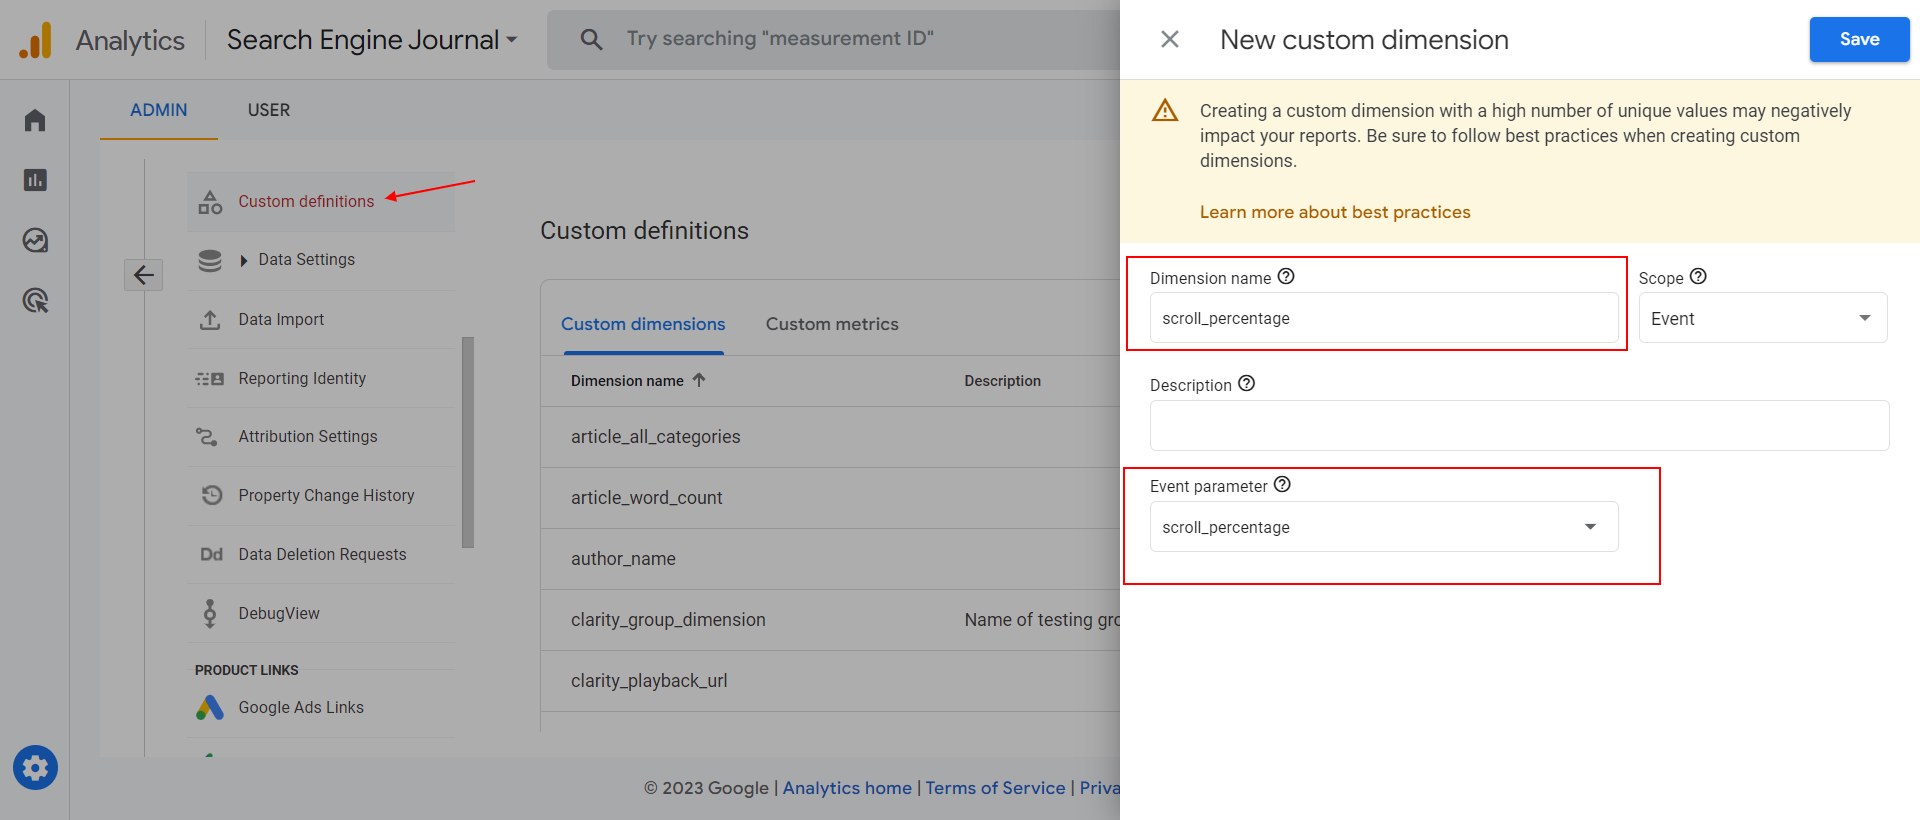 Scroll_percentage custom dimension.
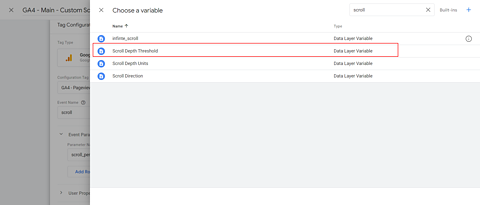
Navigate to Variables in Google Tag Manager and enable these three build-in variables:
- Scroll Depth Threshold.
- Scroll Depth Units.
- Scroll Direction.
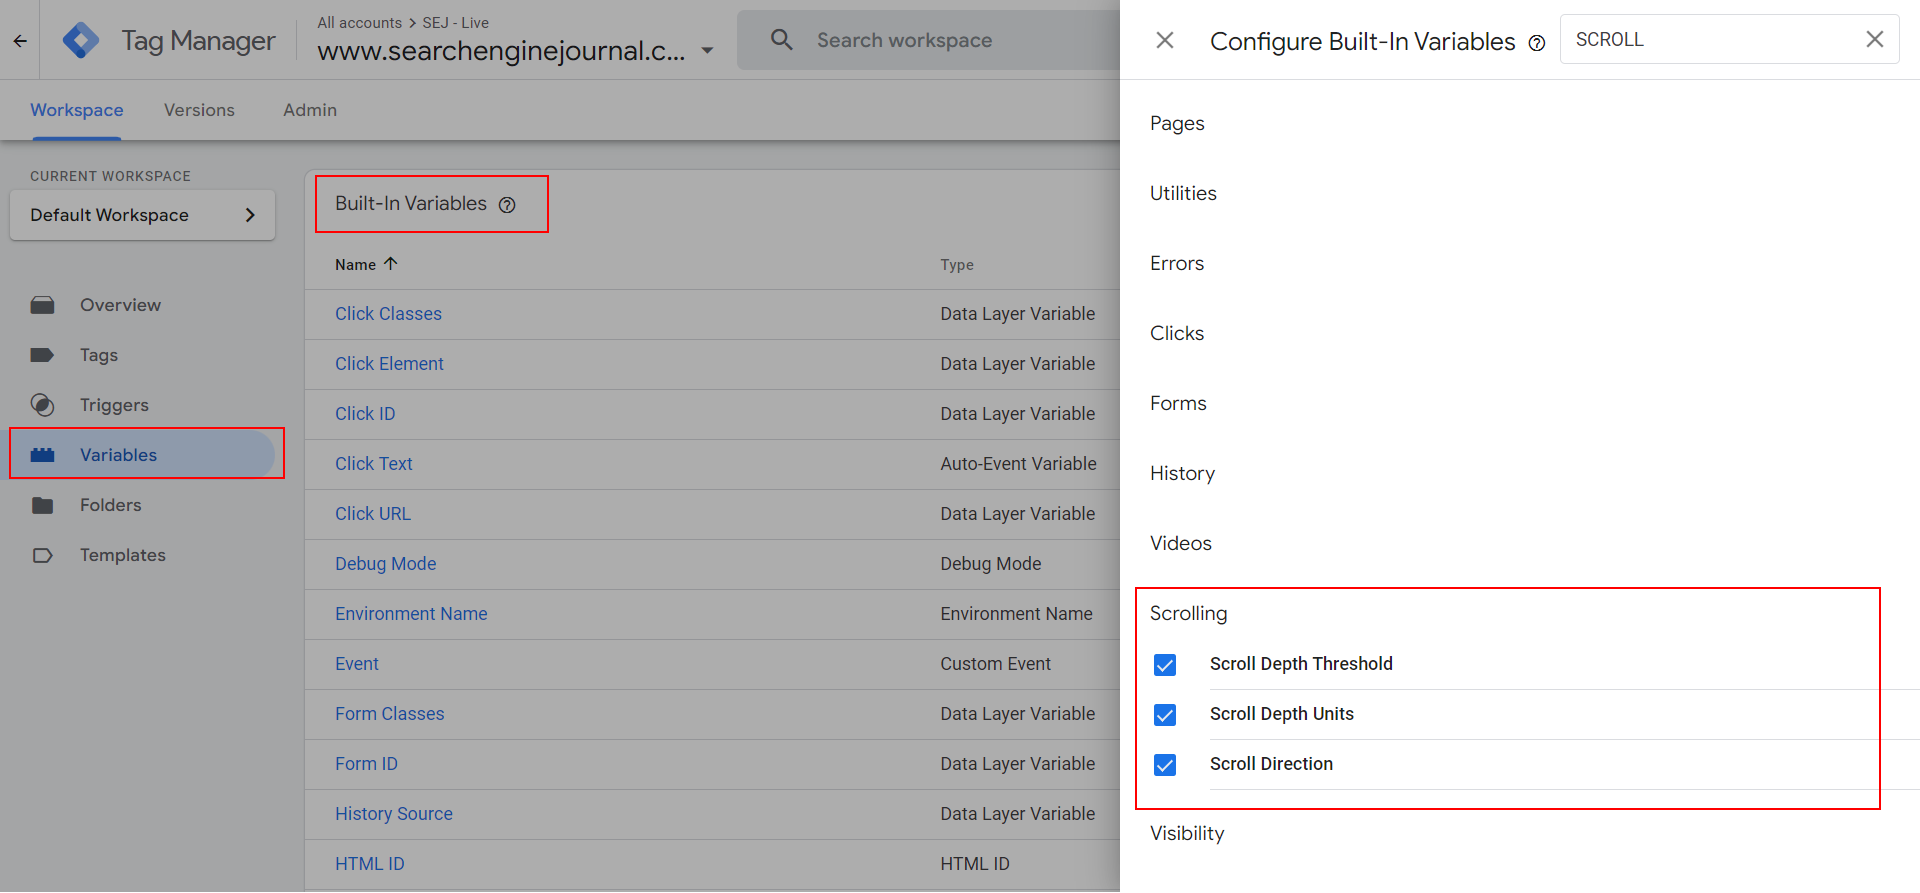 Scrolling variables.
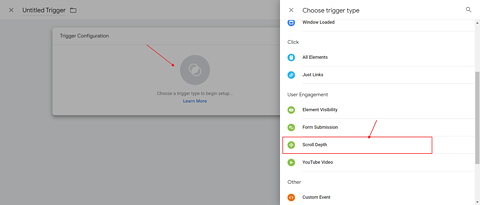
Navigate to Triggers and add a scroll depth trigger with the name “Custom Scroll.”
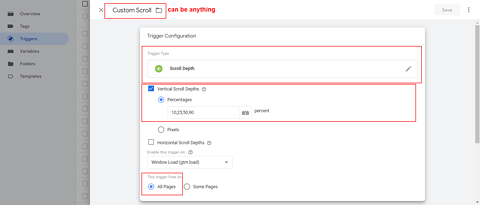
In the “Percentages” settings, add the scroll depth levels you want to track as a comma-separated list.
Please note: If you have a high-traffic website and you add too many thresholds like (21,22,23….90) etc., you may hit GA4’s BigQuery 1M daily events export limits and lose one of the greatest benefits of GA4.
You may notice that there are also pixel values you can use to track scroll depth with pixels.
In some cases, it may make sense to use, but in my opinion, it doesn’t have wide use cases.
For instance, tracking a scroll depth of 1000 pixels might not accurately tell you how much of an article users have read, since articles can vary greatly in length, ranging from 2000 pixels to 10,000 pixels.
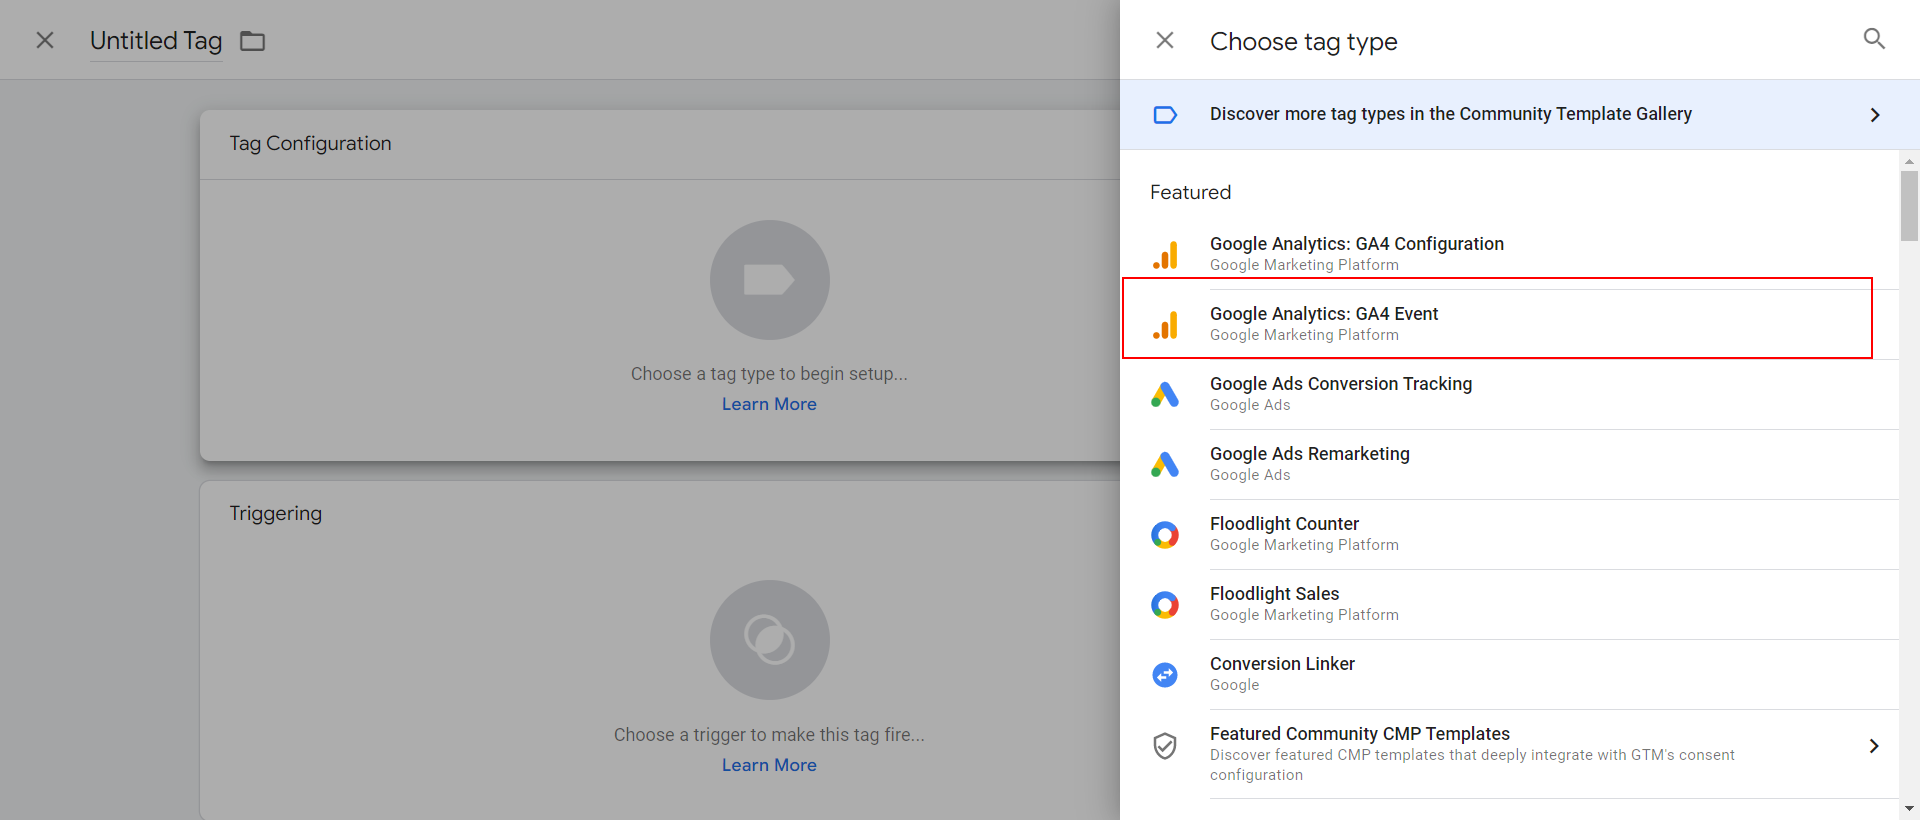
Go to Tags in GTM and add an Event tag.
 Event tag.
In the event name, type “scroll” and set the custom parameter to “scroll_percentage.”
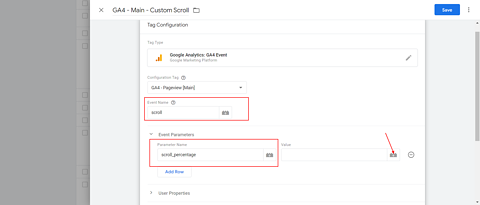
Choose a trigger Custom Scroll.
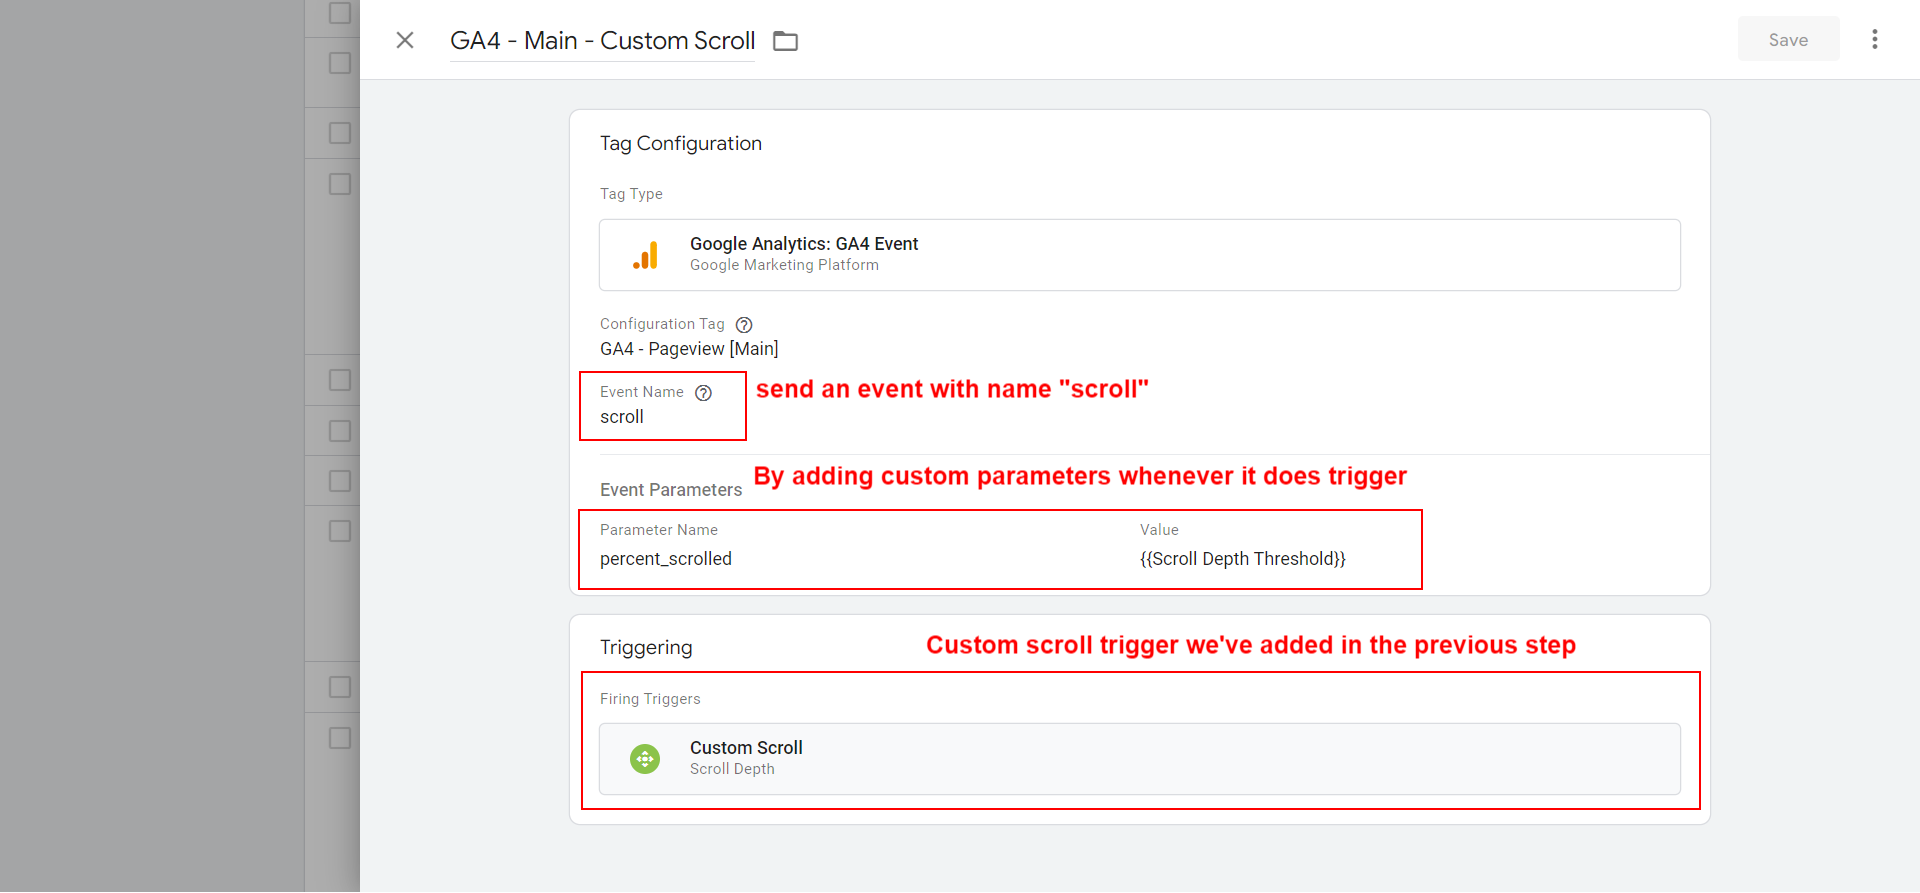 Set a trigger “Custom Scroll.”
In a nutshell, custom scroll tracking works by:
- Disabling default scroll tracking.
- Re-adding the same scroll tracking with the event name “scroll.”
- Sending scroll depth thresholds in a custom parameter.
Once you have the scroll depth tracking setup, let’s dive into how to set up Looker Studio (formerly Google Data Studio) dashboard that will report the articles with their average scroll depth.
How To Create Looker Studio Report On Scroll Depth
Open Looker Studio and add GA4 as a source.
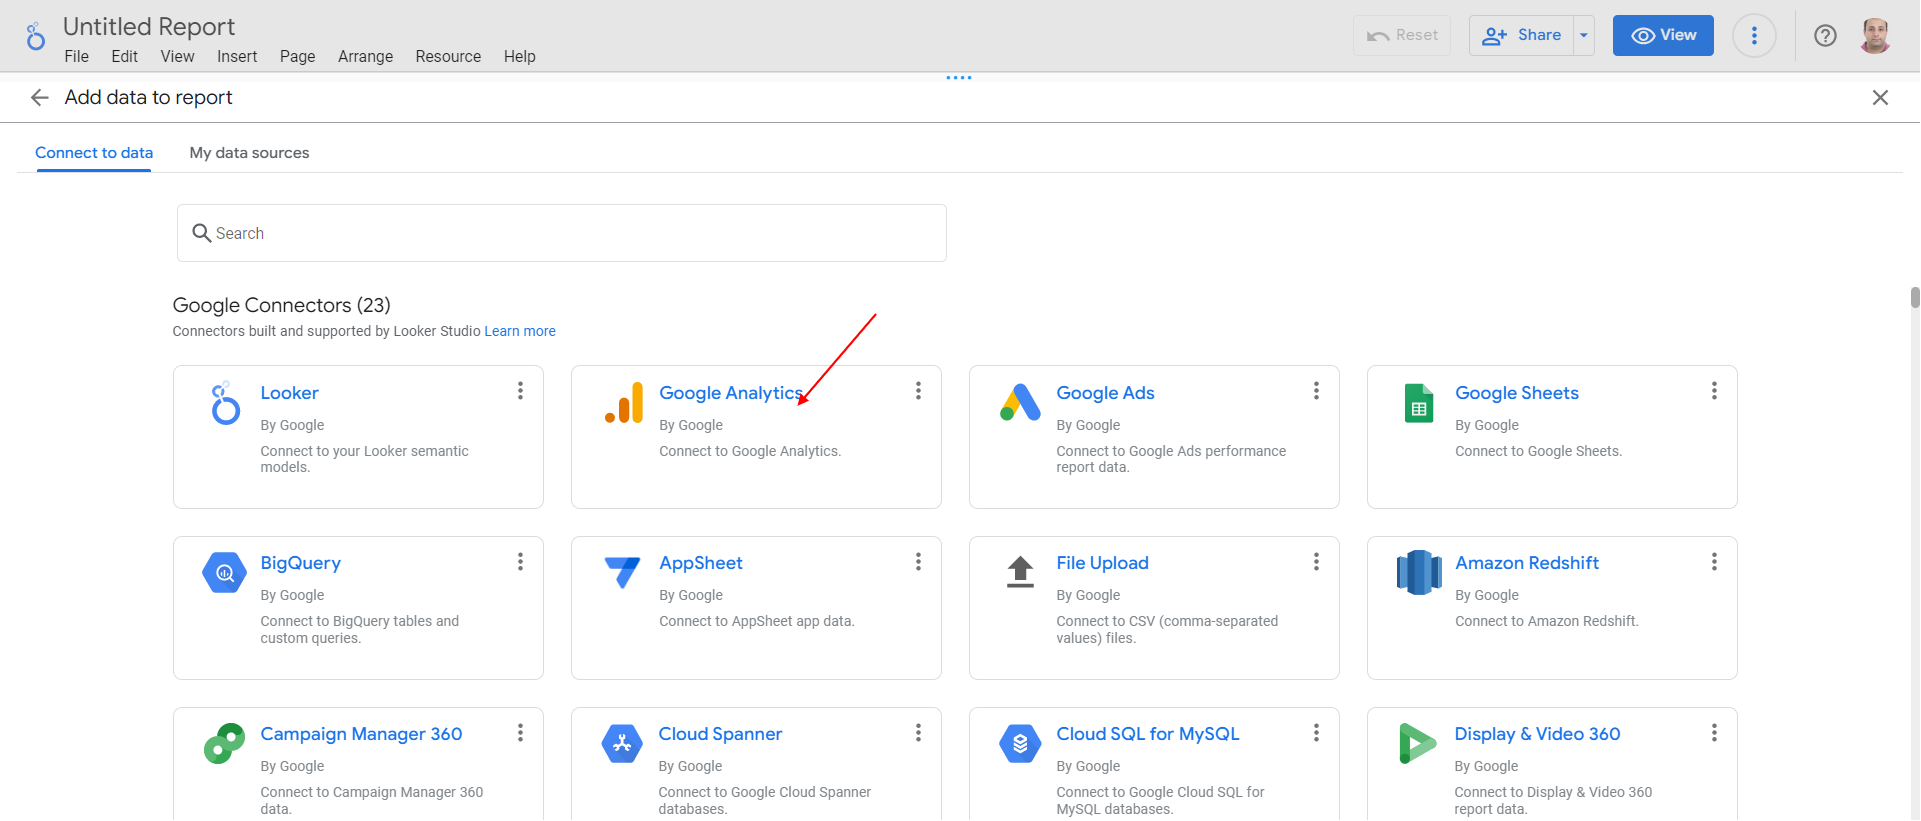 Looker Studio.
Insert Pivot Table as a chart type.
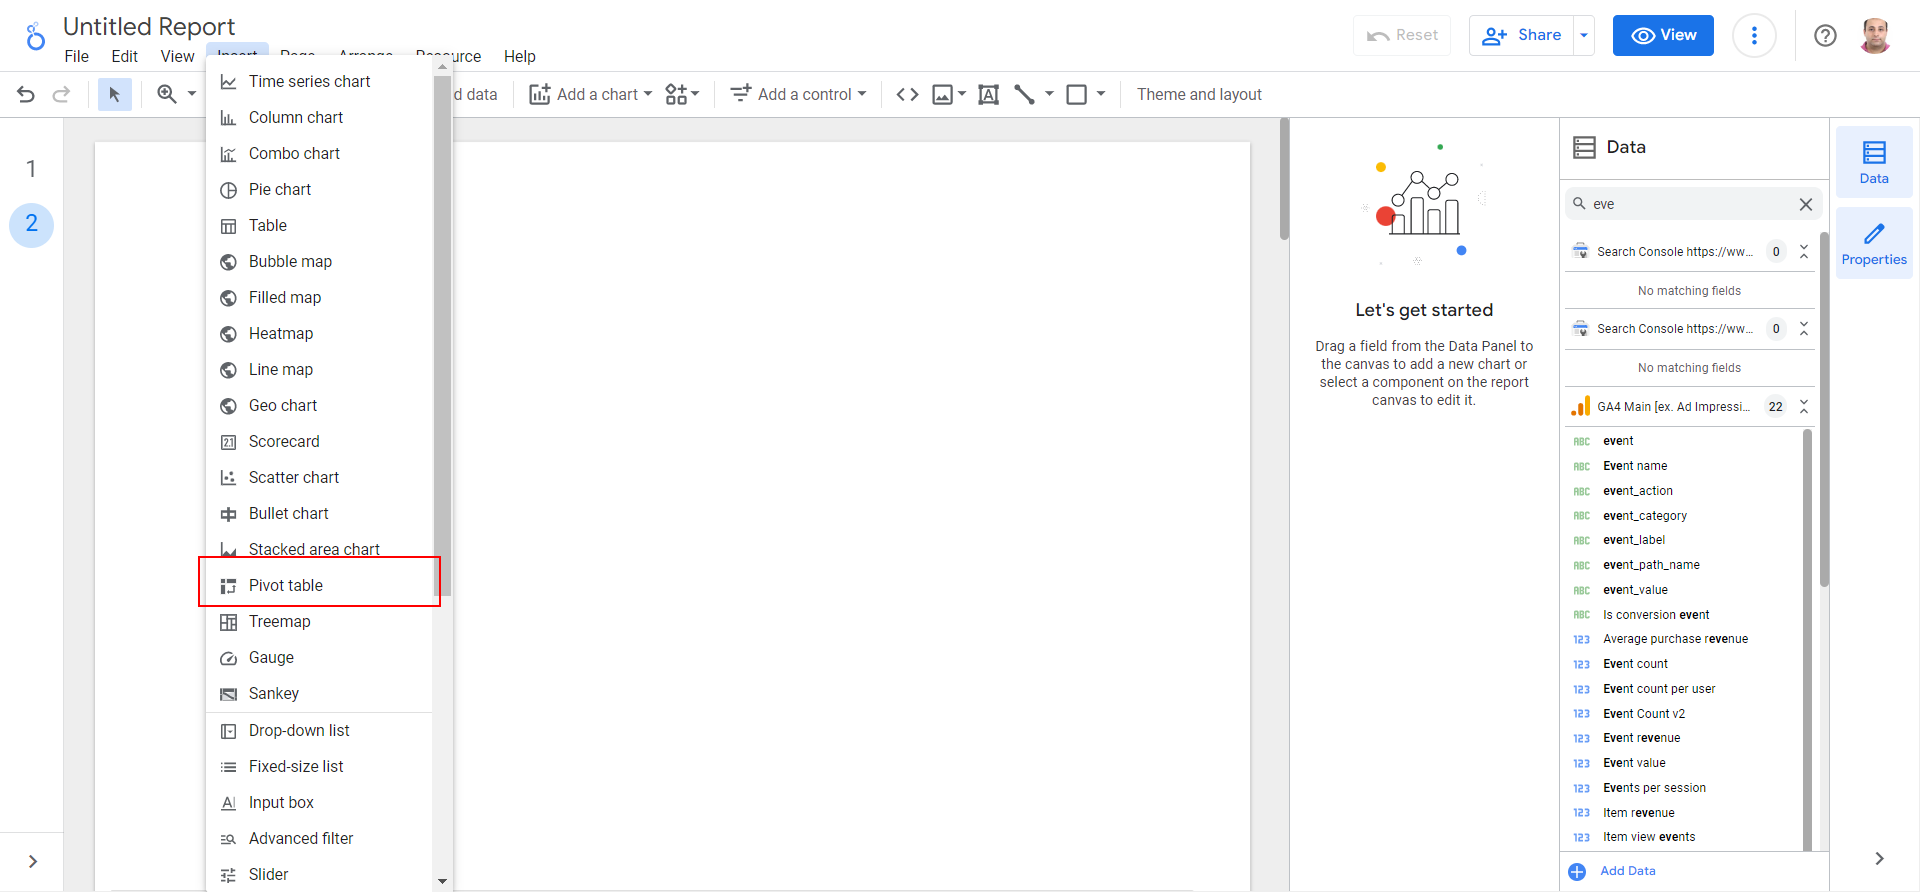 Pivot Table.
Add “Page path” as a row dimension and scroll_percentage as a column dimension. As a metric, add “Total Users” and “Event Count.”
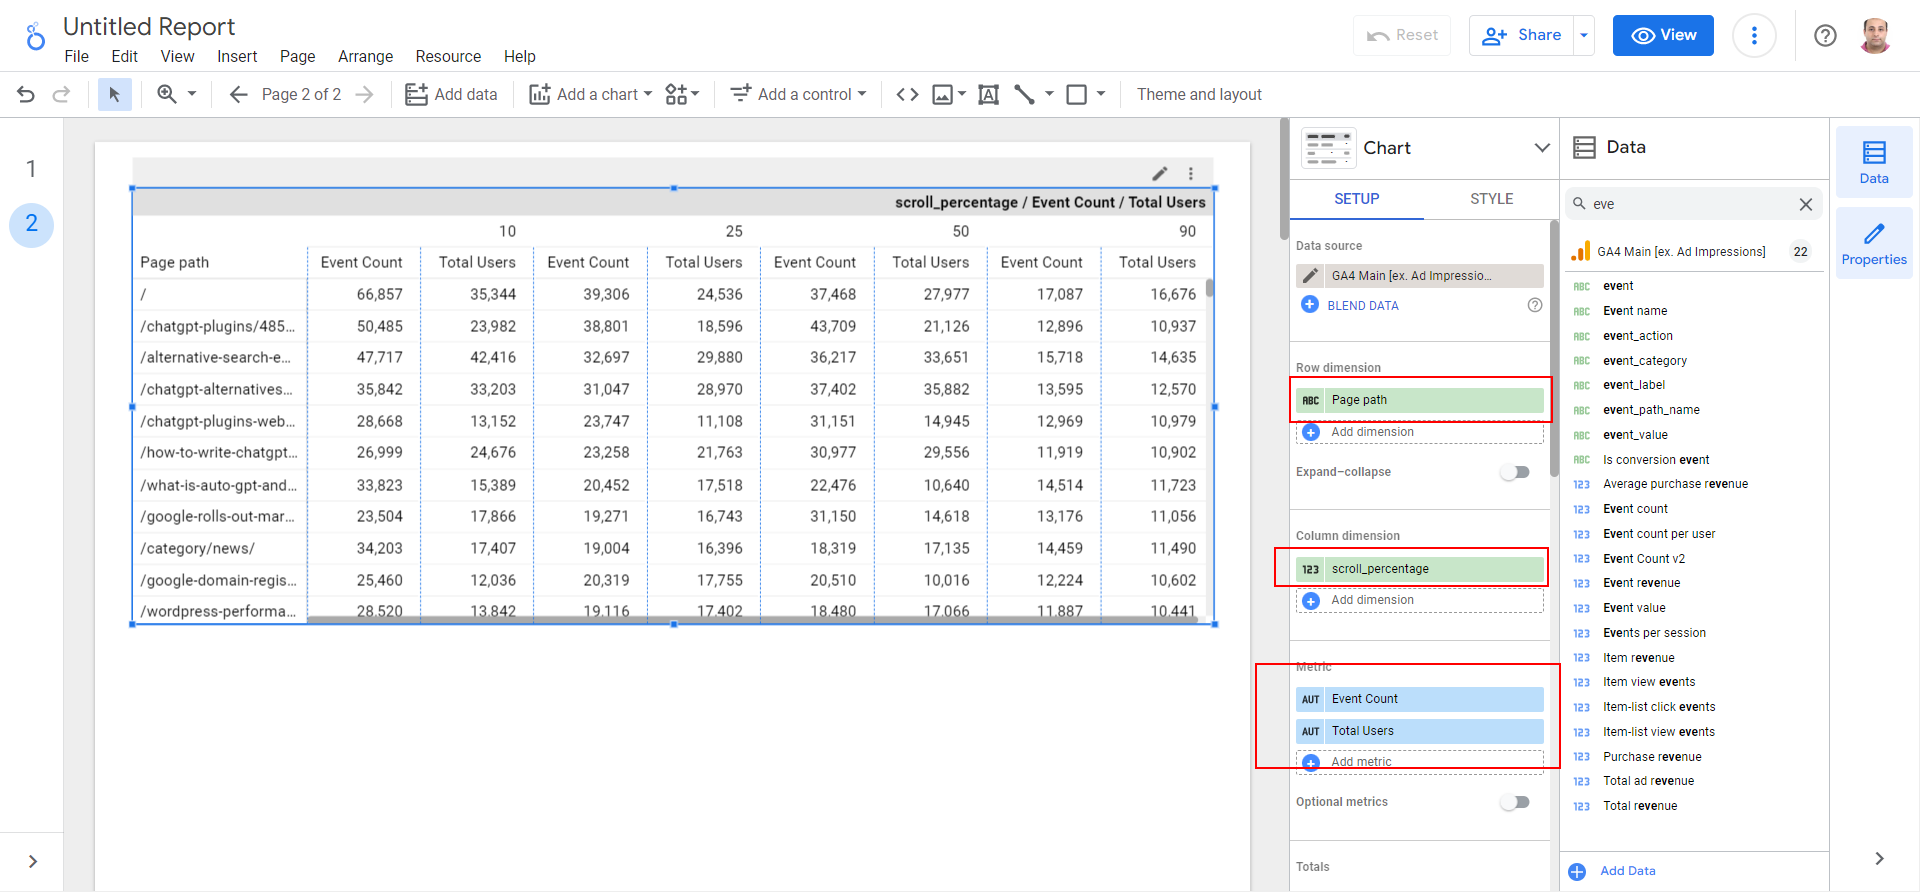 Pivot Table with Data.
Apply a filter with “Event name” containing “scroll” to filter out other events, such as “page_view” from the data.
Because of GA4 data structure specifics, it is pulling all events, and a filter is needed to eliminate none scroll events.
How To Create Scroll Depth Report In Explorations
The same report can be created in explorations, even though I recommend using Looker Studio because you can share it with your editorial team, and it is easier to read.
In order to create a scroll depth report in explorations, navigate to Explore and create a blank “Free Form” report. Add dimensions such as “Page path” and “scroll_percentage.”
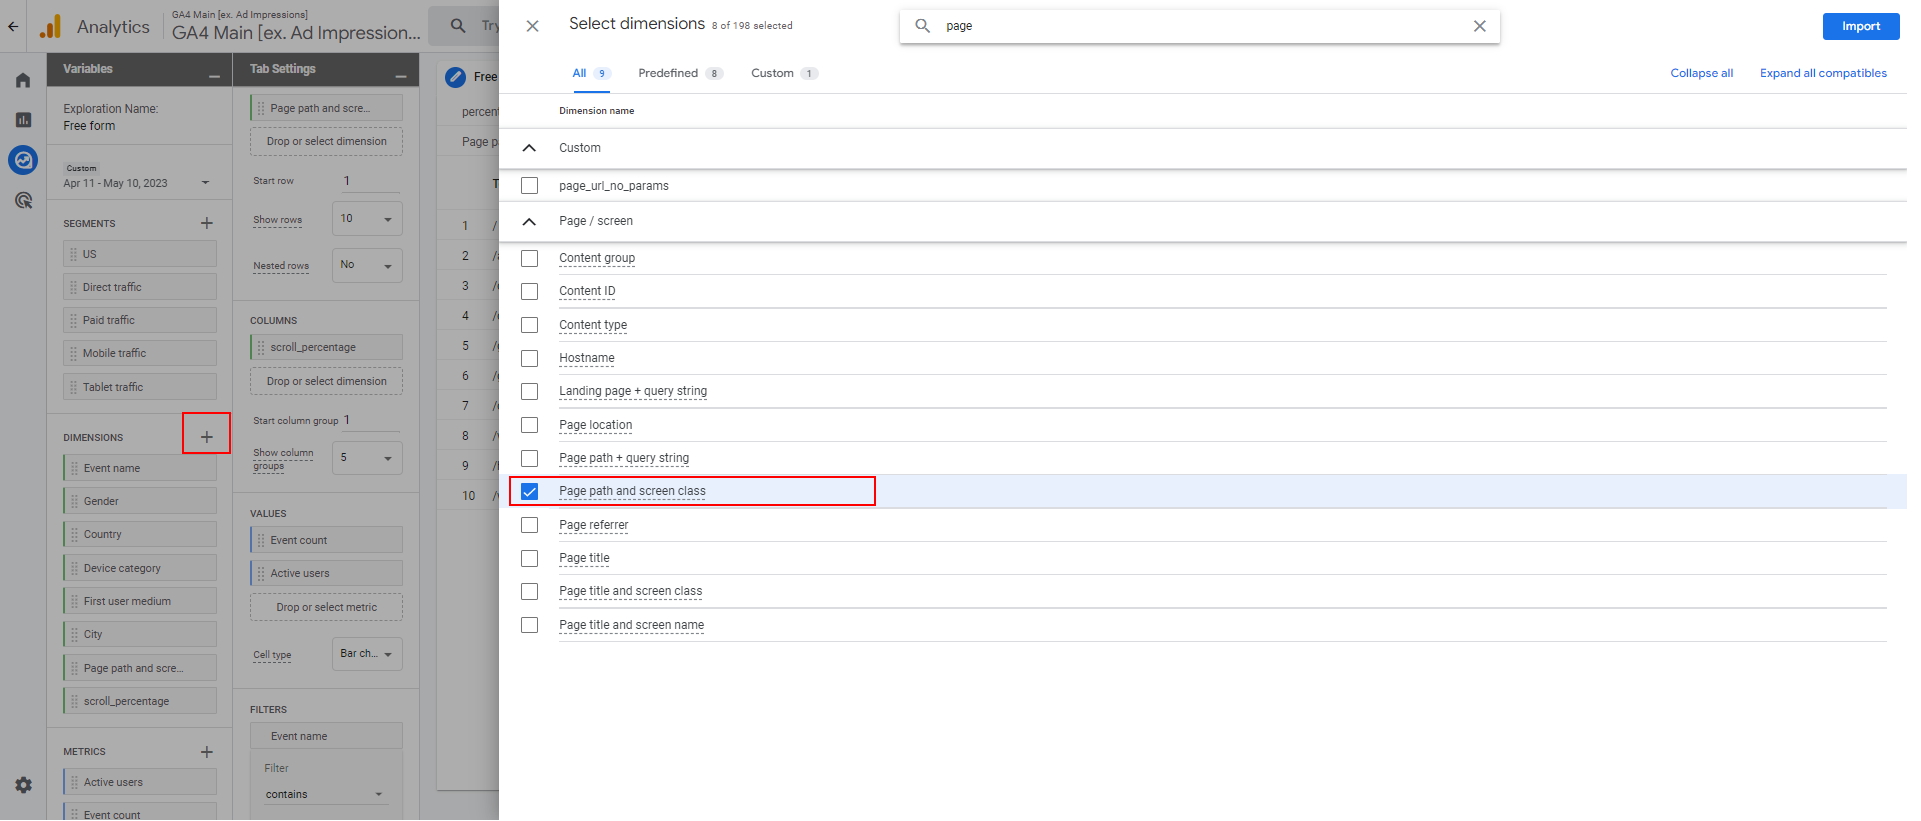 Exploration.
Build the report according to the screenshot.
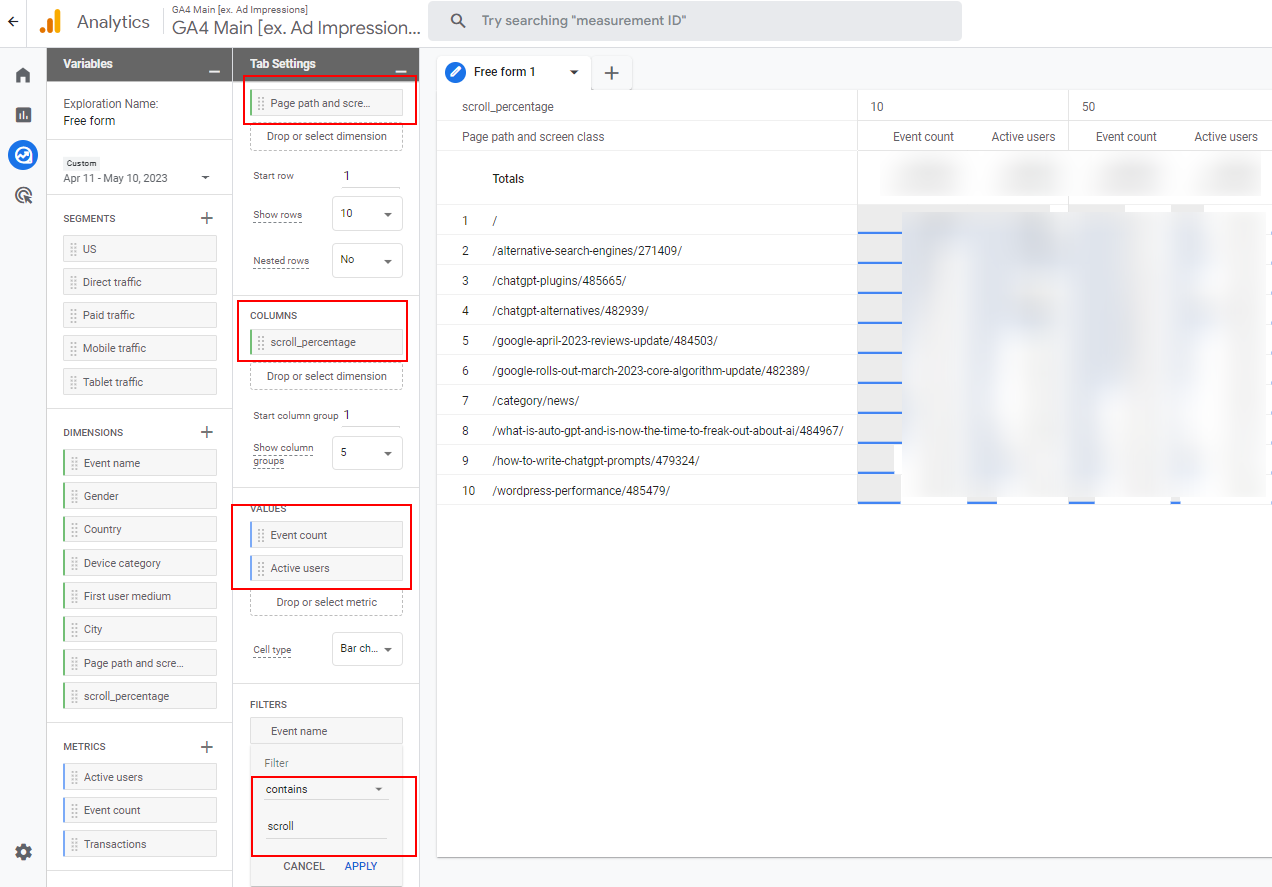 Scroll depth report.
Don’t forget to filter only events with the name “scroll.”
It is also useful to set conversions based on scroll depth. For example, we have a conversion set whenever one reads 50% of an article.
In order to set up conversion based on scroll depth, we will use one of GA4’s greatest features, which is setting up an event based on events parameters.
Navigate to Events settings and click the Create event button in the upper right corner.
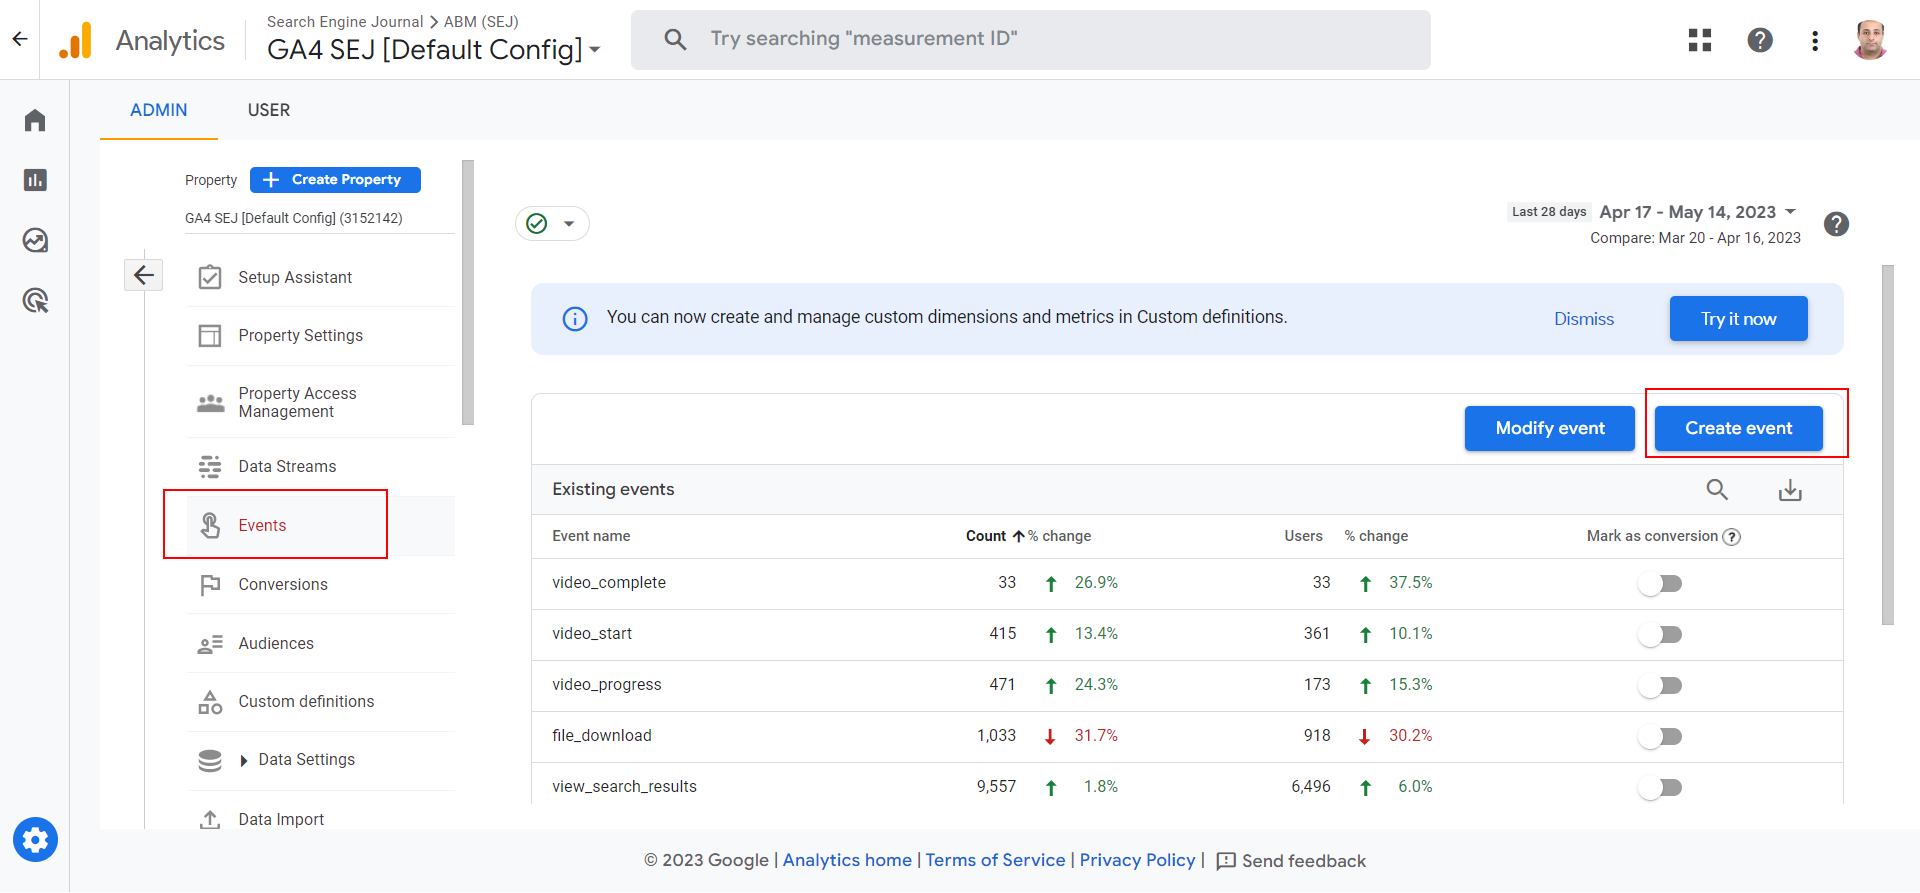 Events
In the popup dialog, enter the “Event Name=scroll” and “scroll_percentage=50” and name your event.
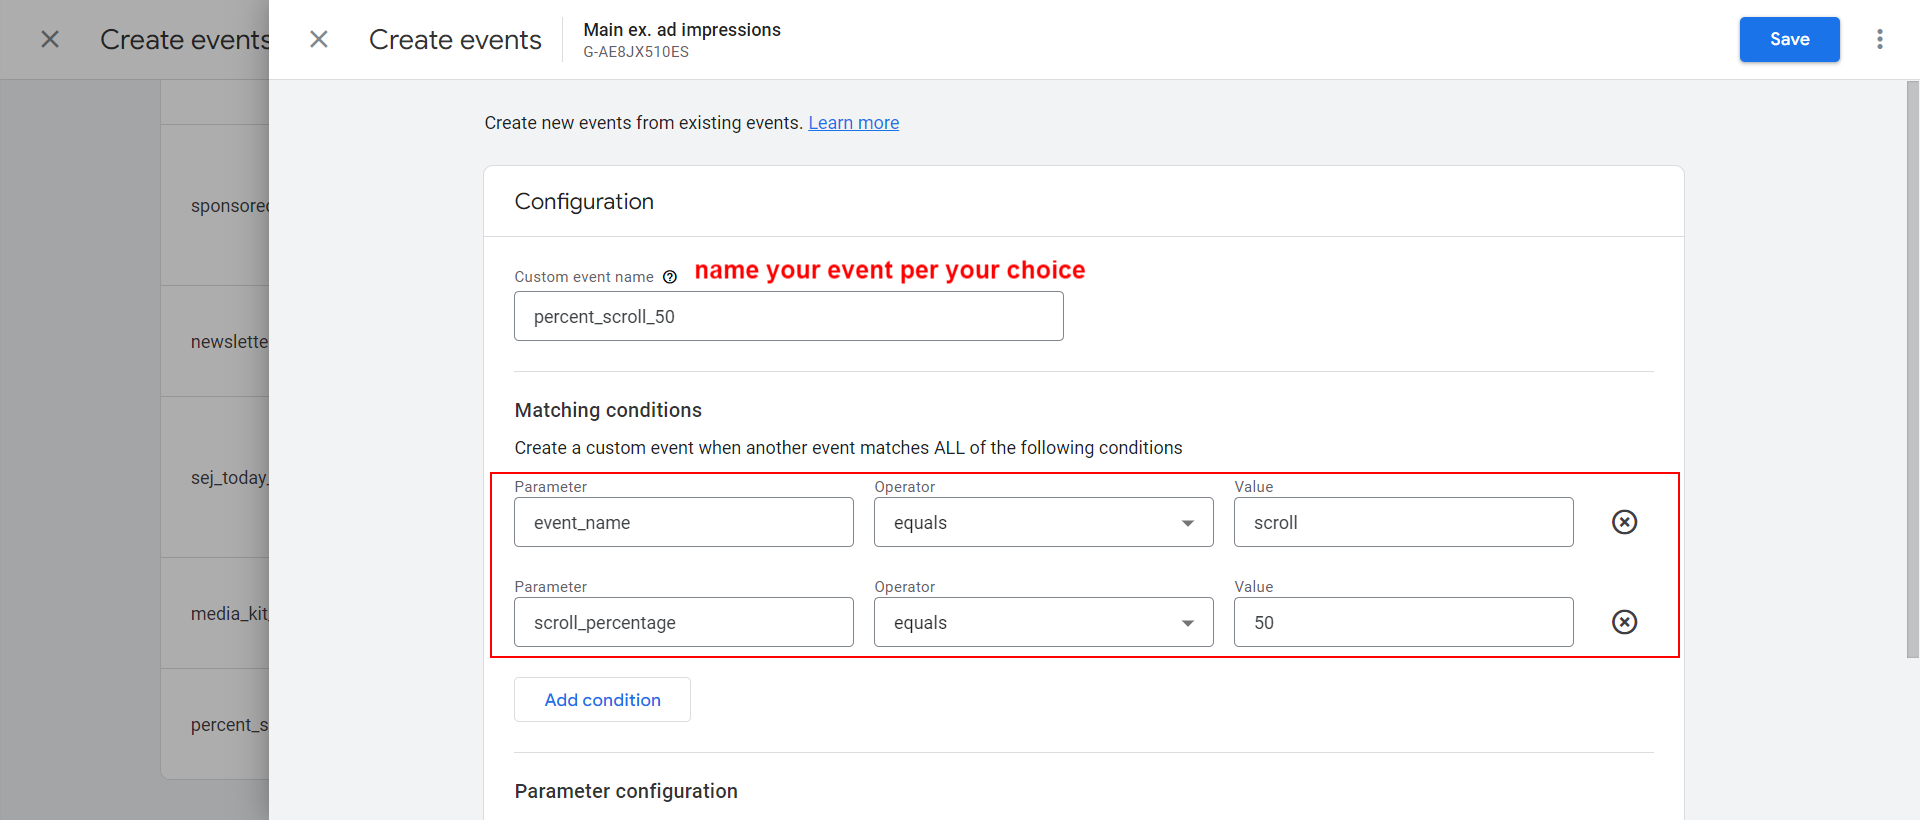 50% scroll custom event based on scroll depth parameter.
And from Conversions settings, mark it as a conversion.
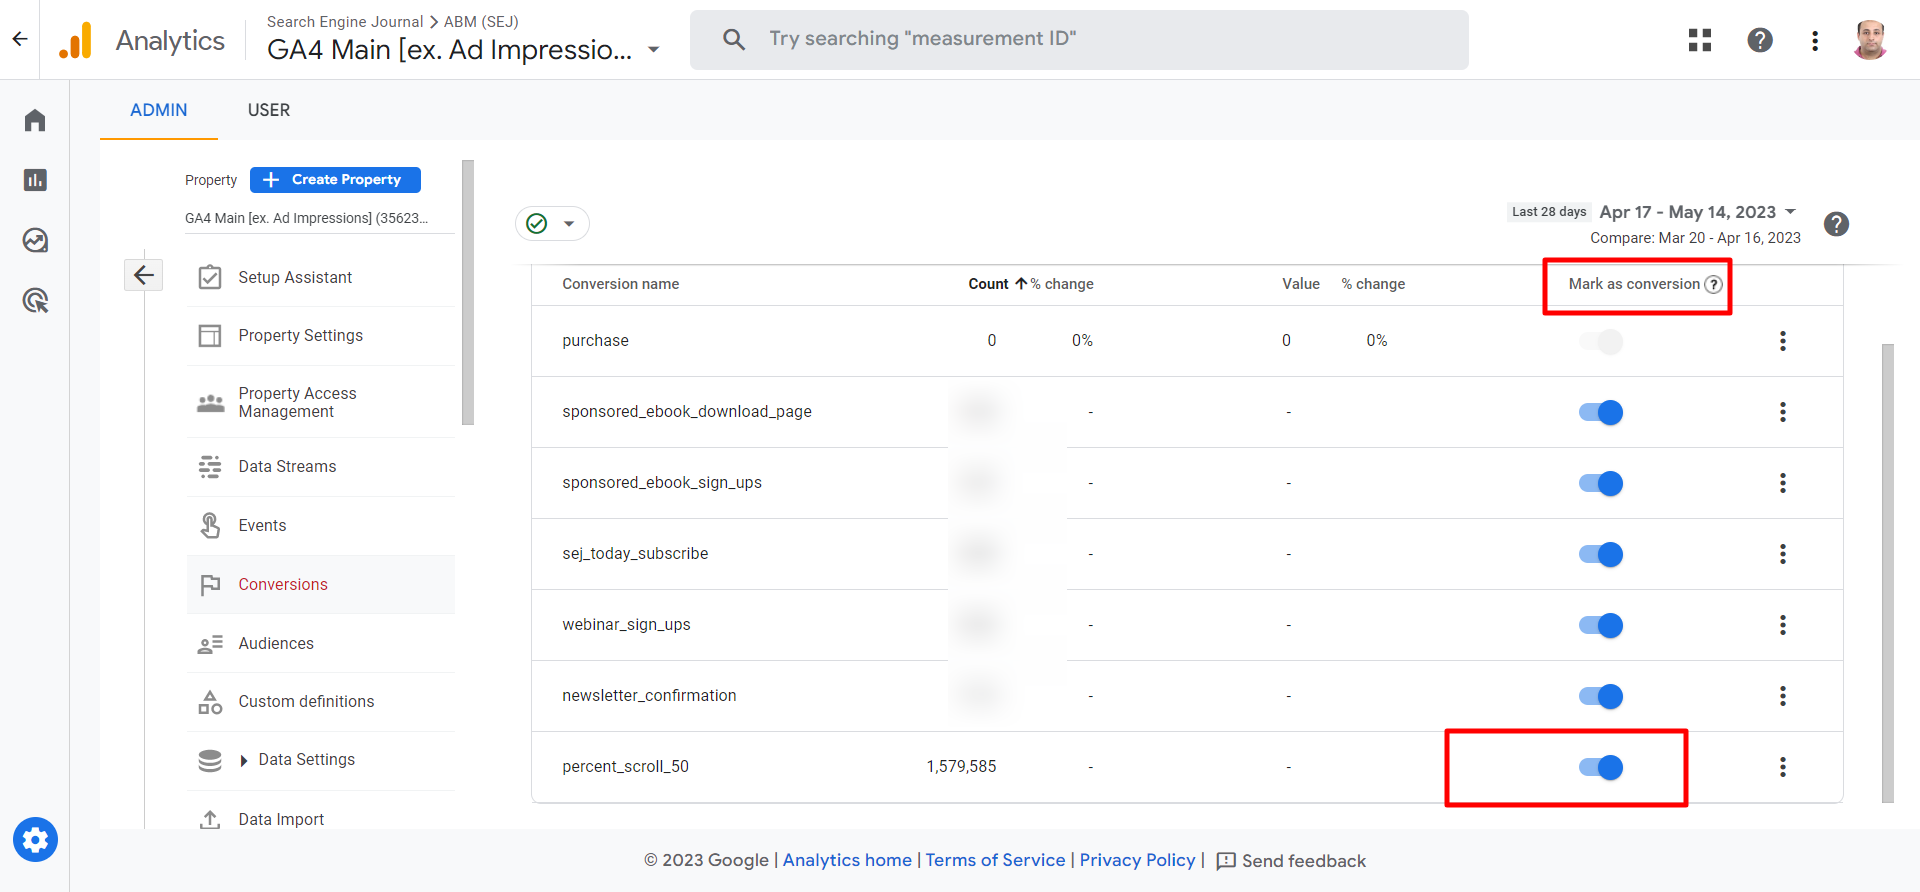 Conversions.
Conclusion
Here we’ve discussed how to track scroll depth in GA4, which is an important metric to measure your audience engagement.
I would recommend trying to build different segments and comparing how each type of user is engaging with your content.
Consider also blending data with Google Search Console and see which keywords drive more engagement with your content.
In the future, we will cover more on how to use GA4 and help you set it up.
To stay updated with our upcoming guides, we invite you to subscribe to our newsletter.
More resources:
Featured Image: fizkes/Shutterstock