
Additional data from Search Console is now available through the Google Data Studio connector, allowing users to visualize traffic from more Google sources.
This update is announced by Google Search Advocate Daniel Waisberg in his second post of a blog series related to Data Studio & Search Console.
In case you missed it, his first article focuses on the benefits of connecting Search Console to Data Studio in the first place.
In his second installment, published today, Waisberg announces the addition of more data:
“… we have some good news for Data Studio users: as of today, the Search Console connector includes data for Discover and Google News traffic, similar to the data recently added to the API.”
This means you can now import more than just Search data to Google Data Studio.
Along with this update, Waisberg is sharing a dashboard template you can use in Data Studio to toggle between between different Search Console properties, data types, devices, and more.
Google Data Studio Search Traffic Monitoring Dashboard
Google has created and shared a template to use in data studio to monitor Google Search Performance.
A dashboard can help you find issues as they happen with simple visualizations such as line or bar charts, which are quick to interpret.
If an issue is discovered then you can dig deeper to find the cause of it.
Start by following these steps:
- Sign in to Data Studio
- Create a Search Console data source
- Choose the URL Impression table
Choosing the URL Impression table provides access to data for web, image, video, news, and discover on a URL level basis.
As shown in the example below, you can set up the template to monitor Search data by choosing “web” under the Property Parameter section.
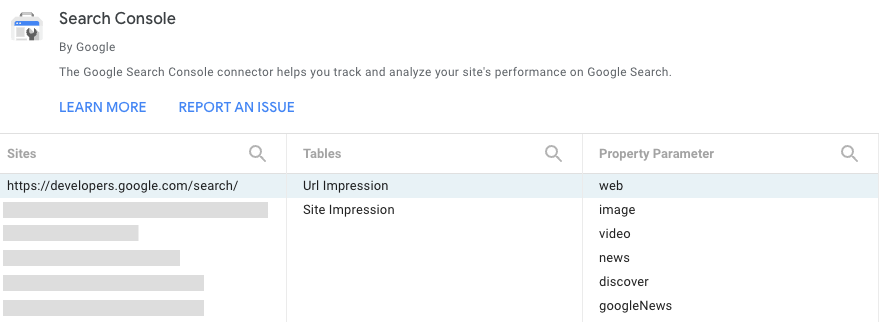 Screenshot from: developers.google.com/search/blog, March 2022.
The parameter you choose will be the default one in your report, but you’ll have access to the others through a filter.
Related: The Beginner’s Guide to Google Data Studio
What Can I Do With A Google Data Studio Dashboard?
Now that your dashboard is set up, here’s more about what you can do with it.
- Specify the data you want to monitor by selecting the desired Search Console property.
- Choose the date range you want to analyze
- Select filters such as country, device, and search type
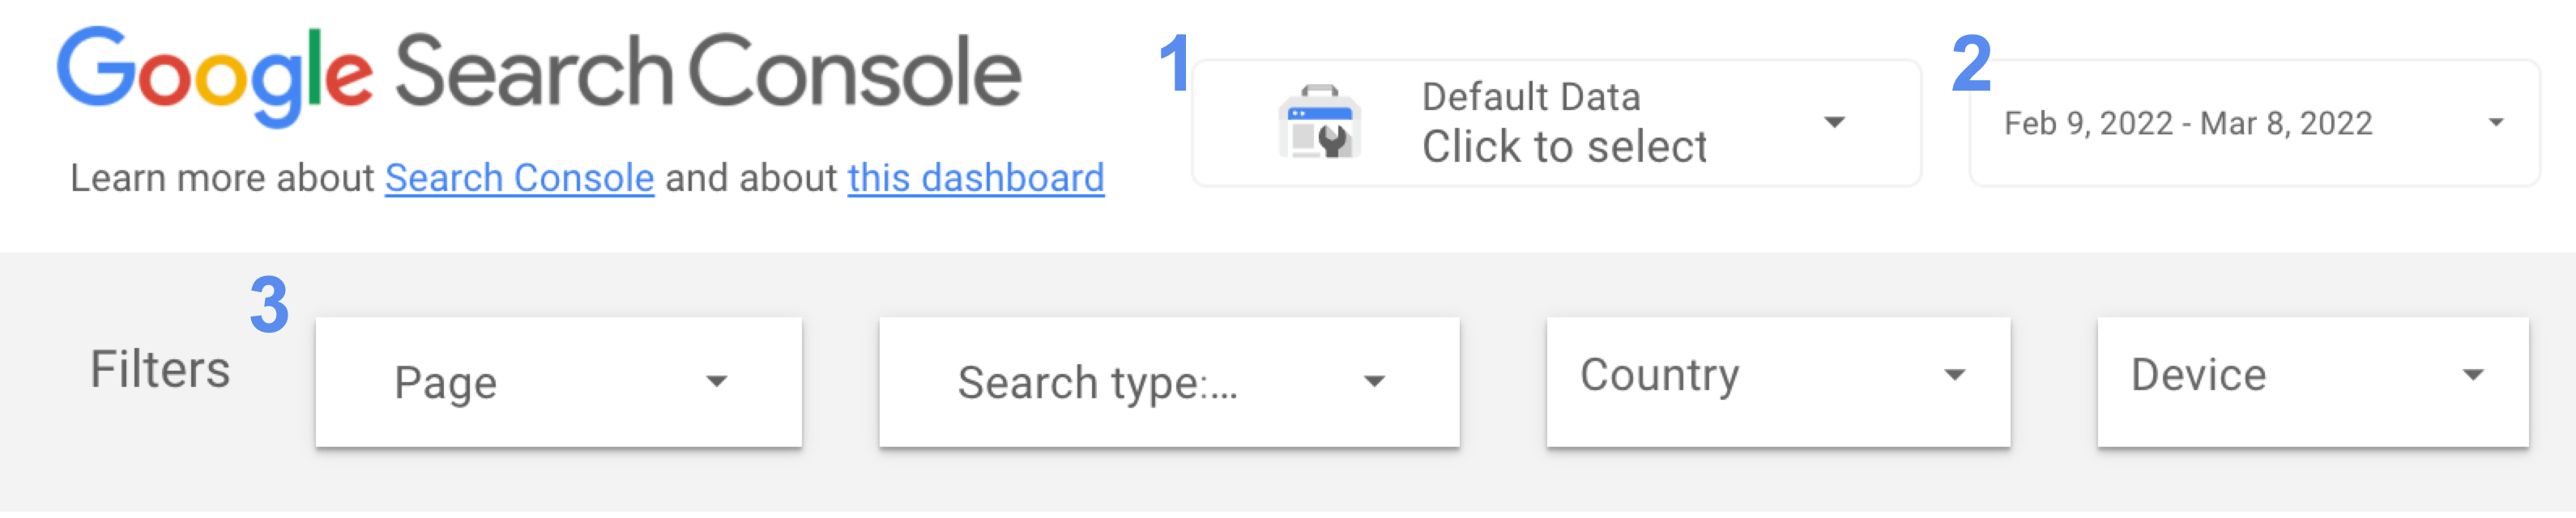 Screenshot from: developers.google.com/search/blog, March 2022.
With those selected, Data Studio will render a line chart like the one shown below.
Google says line charts are the most effective visualizations to show how metrics change over time.
The chart below visualizes clicks and CTR.
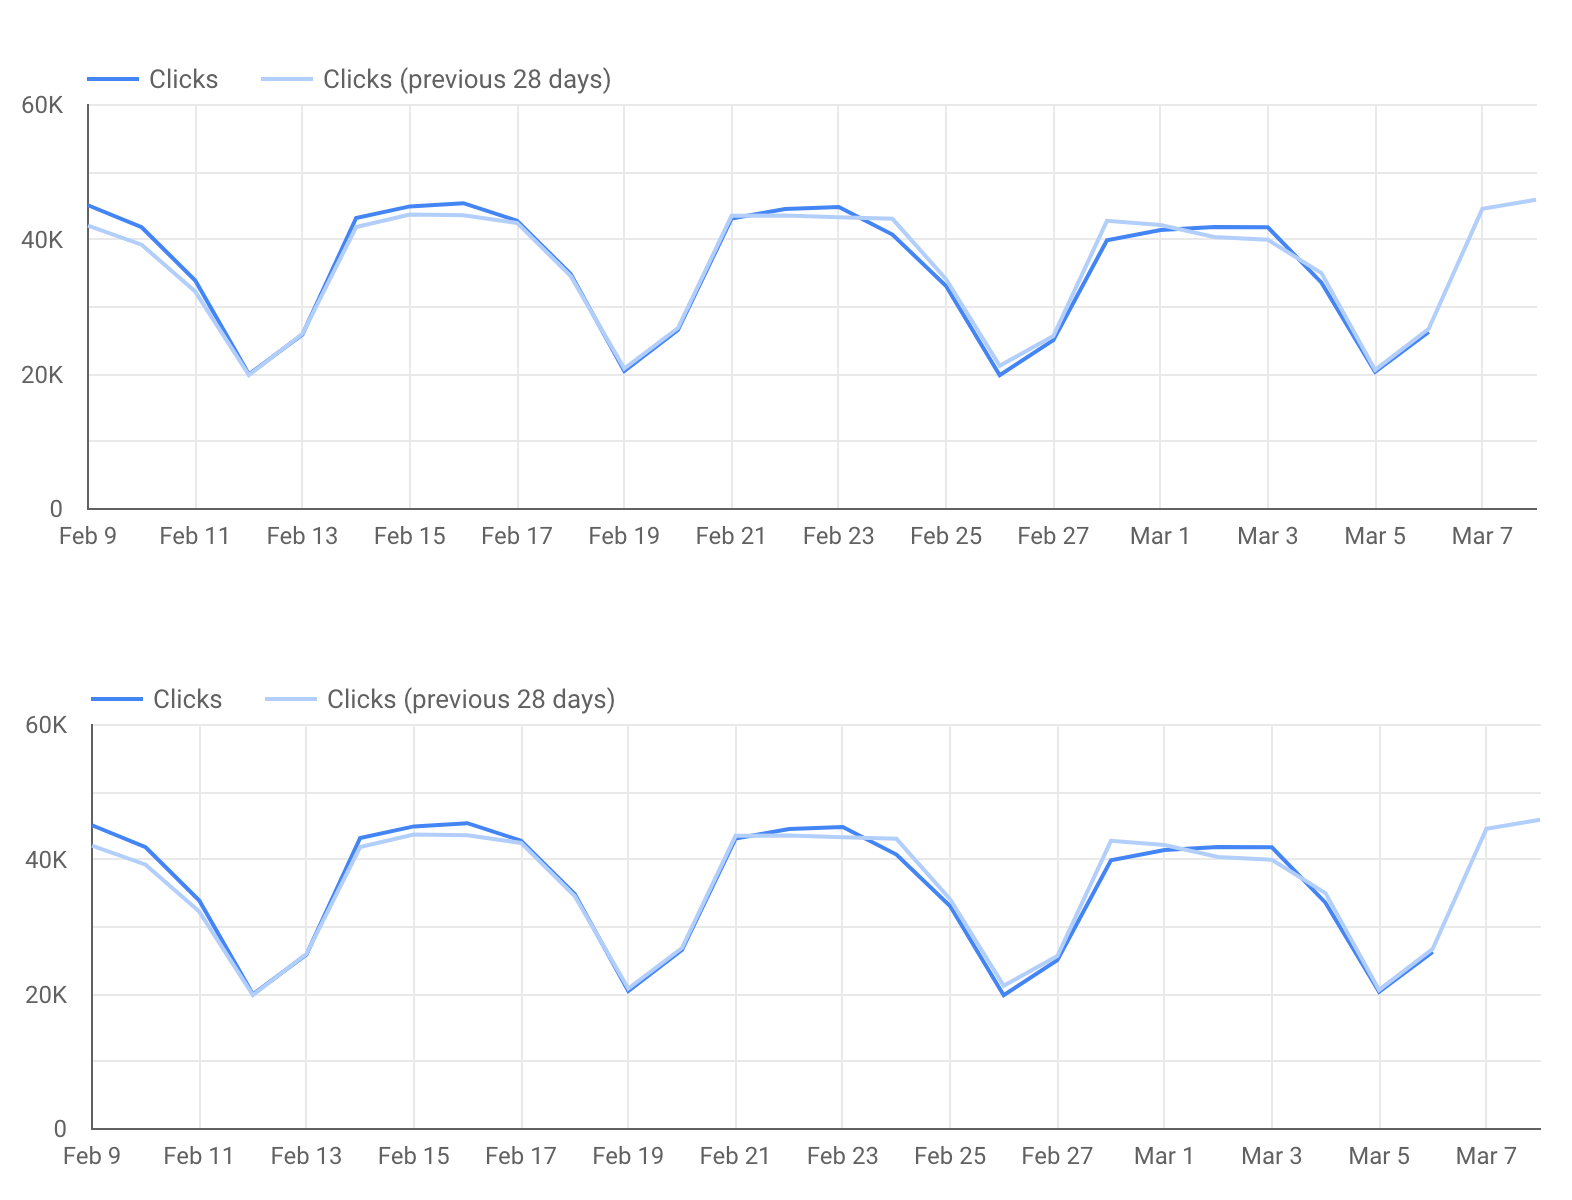 Screenshot from: developers.google.com/search/blog, March 2022.
Another way to analyze data in Google Data Studio is with tables.
With a table you can drill down into particular sections of a website or individual URLs.
See the example below of a table showing clicks and CTR for singular pages:
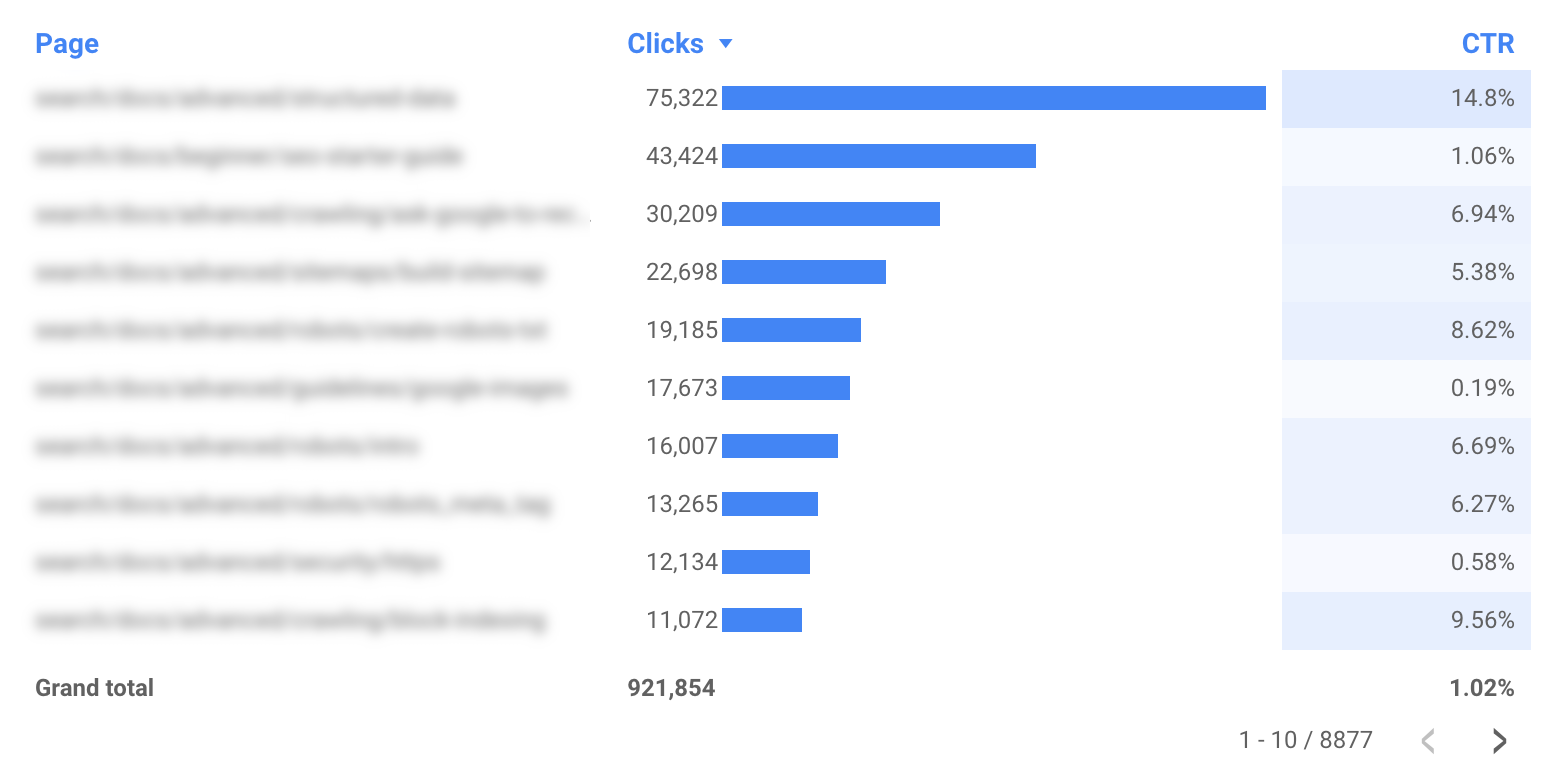 Screenshot from: developers.google.com/search/blog, March 2022.
You can create a table in Data Studio like the one above by using the following filters:
- Use the page filter to include only specific sections of your website.
- Use the country filter to check how different pages perform in countries you care about.
- Use the type filter to analyze URL-level performance for each of the data types.
Source: Google Search Central
Featured Image: Novikov Aleksey/Shutterstock