
This post was sponsored by DebugBear. The opinions expressed in this article are the sponsor’s own.
Having a fast website is important not just to provide a great experience for visitors, but also as an SEO ranking factor.
You’ve probably heard of Google’s PageSpeed Insights tool before.
But do you know how to get the most out of PageSpeed Insights? We’ll look at 6 key tips to help you optimize your website performance.
What Is PageSpeed Insights (PSI)?
Website performance has long impacted Google rankings. Accordingly, Google first launched its free PageSpeed Insights tool back in 2010.
PSI is built to help website operators check how fast their website is as well as provide recommendations for how to improve it.
Why Does Page Speed Matter For SEO?
In 2021, Google introduced a new set of website performance metrics, called the Core Web Vitals. The three metrics are:
- Largest Contentful Paint: how fast does your website load?
- Cumulative Layout Shift: do page elements move around unexpectedly?
- Interaction to Next Paint: does the page respond to user input quickly?
A good page experience is rewarded in Google rankings. There’s a “Good” rating threshold for each metric that you need to reach.
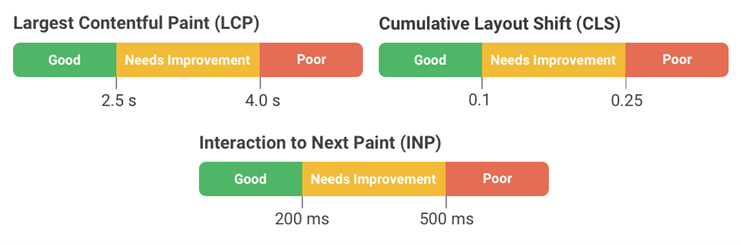 Graphic showing Core Web Vitals rating thresholds, September 2024
How To Test Your Website With PageSpeed Insights
Running a performance test with PageSpeed Insights is easy:
- Open PageSpeed Insights
- Enter your website URL
- Click “Analyze”
Test results will appear in just a few seconds. There’s a lot of data, but we’ll explain what it all means next.
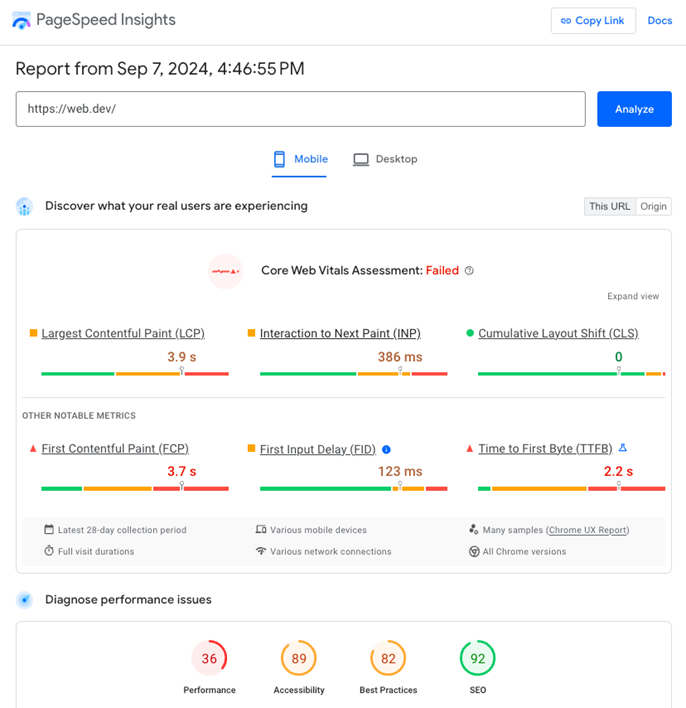 Screenshot of test result on PageSpeed Insights, September 2024
1. Understand Where PageSpeed Insights Data Comes From
Each test result on PageSpeed Insights consists of two key sections: “Discover what real users are experiencing” and “Diagnose performance issues”. Each section shows a different type of page speed data.
What Is The Real User Data In PageSpeed Insights?
The real user data in PSI comes from the Chrome User Experience Report (CrUX).
This data is collected from Chrome users on desktop devices and on mobile devices running Android. To contribute to the CrUX report, users need to:
- Be logged into their Google account
- Have opted into browser history synchronization
- Have enabled usage statistics reporting
Wondering if your experiences are included in this real user data? Open the chrome://ukm URL in your Chrome browser and check if metrics collection is enabled.
The real user tells you how fast your website is for actual visitors and how it’s impacting your SEO.
However, the CrUX report also comes with some limitations:
- Data is always aggregated over a 28-day period, so you won’t immediately see if your website is getting worse
- You can see how fast your website is, but CrUX does not tell give you any diagnostic data to speed it up
- Not every page on your website will have CrUX data, as a minimum number of recorded visits has to be reached before Google publishes the data.
You can use a real user monitoring (RUM) tool to get around these limitations. RUM data has several advantages over CrUX data, like instant updates and detailed diagnostics.
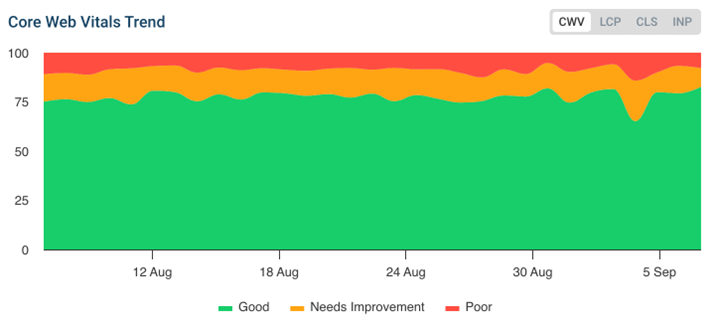 Screenshot of a Core Web Vitals trendline in DebugBear real user monitoring, September 2024
What Is The Diagnostic Data In PageSpeed Insights?
While the real user data tells you how well your site is doing, the diagnostic data gives you insight into how to optimize it.
PageSpeed Insights uses Google’s open source Lighthouse tool to test your website and provide a detailed analysis. A Lighthouse test is run in a controlled lab environment, which can means that a lot more information information can be collected compared to real user data.
The lab-test is also run on-demand, and is not subject to the 28-day delay that applies to CrUX data.
At the top of the Lighthouse report Google’s shows an overall Performance score between 0 and 100. This score does not directly impact rankings – Google uses CrUX data for that. However, a good Lighthouse score usually means that your website is also loading quickly for real users.
The Lighthouse score itself determined based on 5 performance metrics:
- First Contentful Paint: how quickly does the page start loading?
- Largest Contentful Paint: when does the main page content show up?
- Total Blocking Time: are user interactions blocked by CPU processing?
- Cumulative Layout Shift: does content move around after it appears?
- Speed Index: how quickly does the page content render overall?
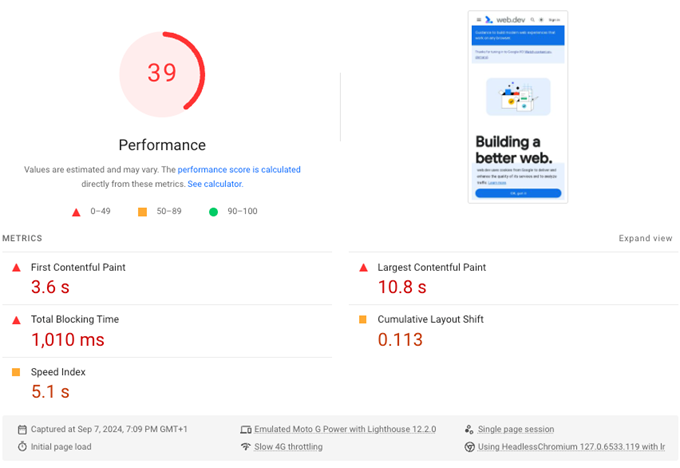 Screenshot of performance metrics in PageSpeed Insights, September 2024
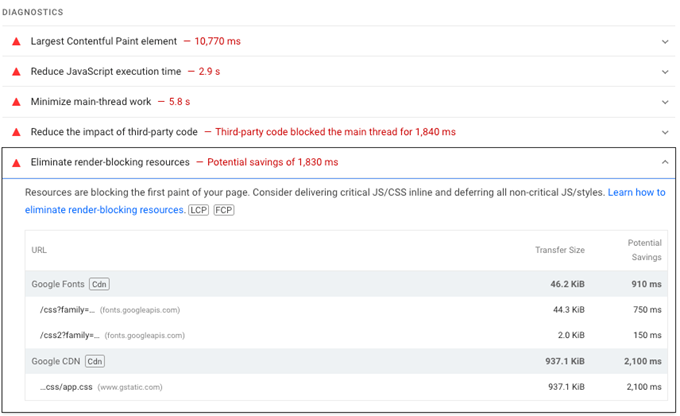
Below the overall Lighthouse assessment you can find diagnostic insight that suggests concrete changes you can make to optimize your website.
Each row audits one particular aspect of your performance. For example, if you eliminate render-blocking resources then it will take less time for page content on your website to become visible.
 Screenshot of performance diagnostics in PageSpeed Insights, September 2024
2. Use The Score Calculator To See What’s Dragging Your Score Down
If you want to improve your Performance score on PageSpeed Insights, where do you start?
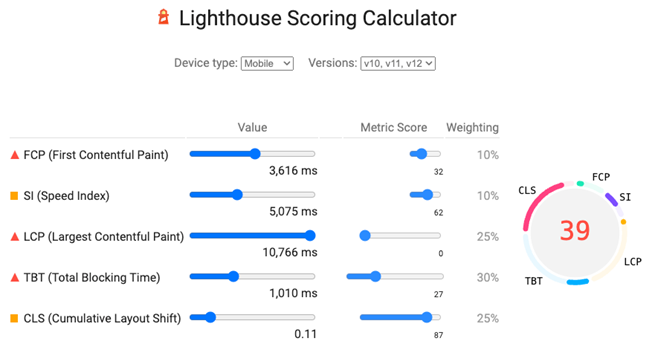
Every Lighthouse report includes a “View Calculator” link that takes you to the Lighthouse Scoring Calculator. This tool tells you how much of the five metrics that Google has measured is contributing to the overall score.
For example, here we can see that the page we’ve tested has a good Cumulative Layout Shift score, while the Largest Contentful Paint receives a poor rating.
We can also see that each metric is assigned a weight. For example, 30% of the Performance score is determined by the subscore for the Total Blocking Time metric.
 Screenshot of the Lighthouse Scoring Calculator, September 2024
3. Review Phase Data For The Largest Contentful Paint (LCP) Metric
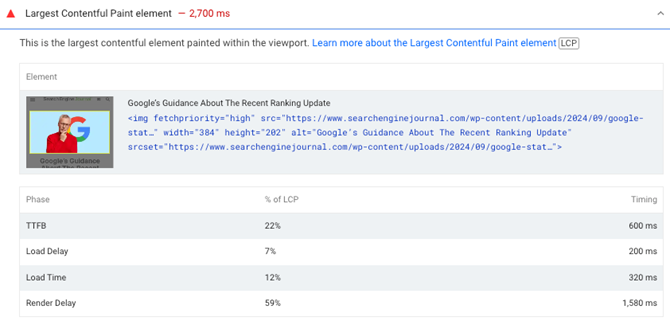
One of the most insightful audits is often the “Largest Contentful Paint element.”
This audit shows you the largest content element on the page. The LCP metric measures how long it takes after opening the page for this element to become visible. The largest content element can be any type of page content, for example, a heading or an image.
That’s very useful, but Lighthouse actually provides additional insight by breaking the LCP metric down into four phases (also called subparts):
- Time to First Byte (TTFB): how quickly does the website server provide the HTML document?
- Load Delay: How soon after loading the document does the LCP image start downloading
- Load Time: How long does it take to download the LCP image?
- Render Delay: How soon after loading the LCP resource does the LCP element become visible?
This information will tell you where you need to focus on your optimization.
For example, in the screenshot below, we can see that the LCP image loaded quickly but then wasn’t rendered right away by the browser. That could be because other resources on the page were blocking the page from rendering.
 Screenshot of the Lighthouse Largest Contentful Paint element audit, September 2024
Google recently ran an analysis to find out what LCP subparts contribute the most to the overall metric value. They found that server response time and image load delay are the biggest factors in LCP optimization for most websites.
While many website performance recommendations have focused on using compact modern image formats, image load time was found to be a minor factor on most slow websites.
However, you should still check the data for your website to see what optimizations can have the most impact.
4. Performance Score Variability Between Tests: What Does It Mean?
We’ve already seen that the real user CrUX data is aggregated over a 28-day period. Accordingly, its value is stable and only changes very gradually.
But the same can’t be said about the Performance score and other metrics measured in the lab. Testing the same page twice will rarely result in the exact same measurements, and often will show high variation. And if you run Lighthouse with other tools like Chrome DevTools you’re likely to see even bigger differences.
There are many reasons for differences between Lighthouse tests, for example:
- Differences in server response time
- Variation in content, for example due to A/B tests or advertisements
- Differences across test devices and test locations
- Inaccuracies during data collection
Google has written a detailed guide on Lighthouse variability. You can run tests several times and look at the average to get a more consistent assessment.
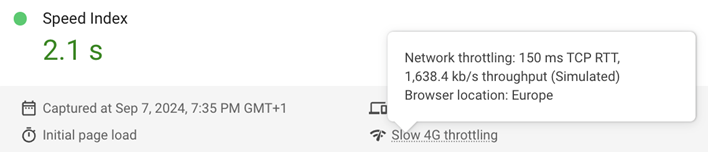
Data Accuracy: Observed Vs Simulated Data
One common reason for discrepancies between page speed testing tools is the way the data is collected. In a lab test the network is throttled to a fixed speed, typically to match a slower mobile data connection. The way this throttling is achieved can impact your measurements.
PageSpeed Insights uses an approach called simulated throttling. Measurements are collected on a fast network connection. After that, a simulation of a slow 4G connection is applied to estimate how the page might have loaded on a mobile device.
You can install the Site Speed Chrome extension to view the original observed metrics when running a test on PageSpeed Insights.
 Screenshot of Lighthouse reported and observed metrics, September 2024
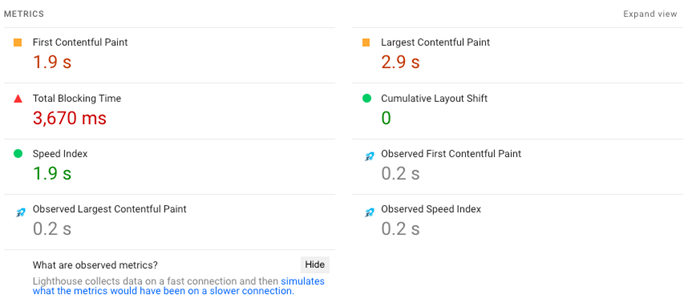
Simulated data can sometimes be unreliable, as the Lighthouse simulation doesn’t handle all real life edge cases that can happen when opening a website.
For example, in this test we can see that the Largest Contentful Paint metric is reported as one second worse than the values observed when opening the page in Chrome.
However, the original values for the First Continental Paint and for the Largest Contentful Paint metrics were identical. This suggests that the simulated metrics could potentially not match what real users experience.
You can check the settings section of the Lighthouse report to see if the metrics were measured as reported or if a simulation has been applied.
 Screenshot of Lighthouse settings, September 2024
If you want to get reliable page speed data, the free DebugBear page speed test is built to provide the most accurate insight. Collecting real measurements takes a bit longer than running a simulation, but it will also help you make the best decisions when optimizing your website speed.
Why Des The Real User Data Not Match The Lighthouse Test Rresults?
When testing your website on PageSpeed Insights you’ll often find that the real user metrics are much better than those reported by the synthetic Lighthouse test. Why is that?
That’s because the Lighthouse test uses a very slow network connection. The CrUX Core Web Vitals data looks at the slowest 25% of user experiences on your website, but typically, even those visits come from a device that has a decent network connection.
So, a bad Lighthouse performance score doesn’t necessarily mean that you’ll fail Google’s Core Web Vitals assessment. But it can indicate that some users are having a poor experience and that there’s more room for improvement.
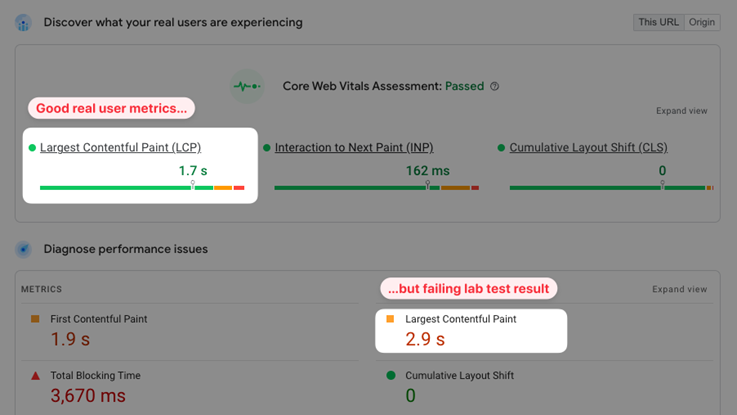 Screenshot of real user and lab-based performance metrics in PageSpeed Insights, September 2024
5. Use The PSI API To Automate Performance Testing
Got a lot of pages on your website you want to test? You can use the PageSpeed Insights API to automatically run website tests in bulk.
The API provides more detailed performance metrics and details on each Lighthouse audit. For example, you can use the API to see the most common performance recommendations across your website.
There’s even a way to access PageSpeed Insights data directly in Google Sheets.
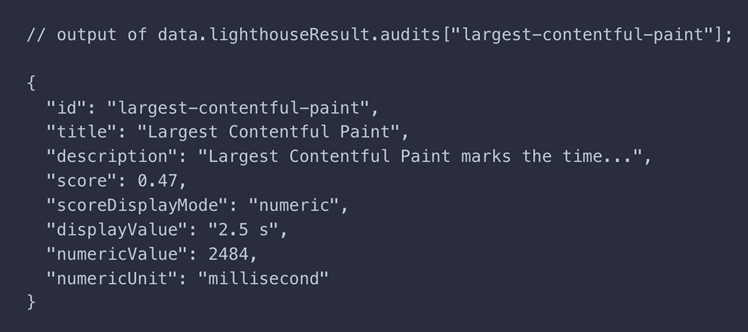 JSON page speed data reported by the PageSpeed Insights API, September 2024
6. Know When To Reach For A Different Tool
PageSpeed Insights is a great tool to run a quick performance for a specific URL on your website. However, as we’ve seen above, this data comes with some limitations.
If you just want to get a site-wide overview of Core Web Vitals on your website, the quickest way to find this data is using Google Search Console.
Search Console will show you exactly how many pages on your website are slow or need to be improved.
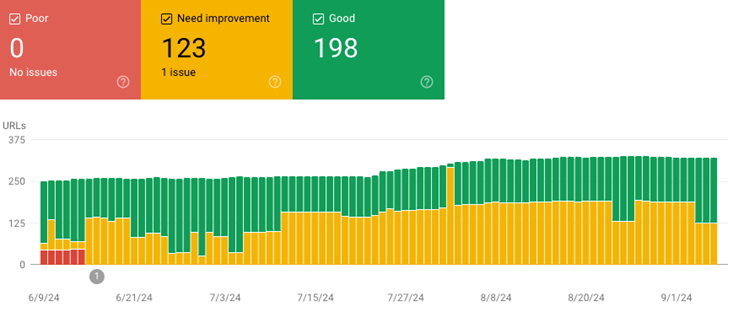 Screenshot of Core Web Vitals data in Google Search Console, September 2024
Need to dive deep into CPU performance, for example to optimize the new Interaction to Next Paint metric?
The Performance tab in Chrome’s developer tools provides a detailed analysis of all kinds of CPU processing that happens on your website.
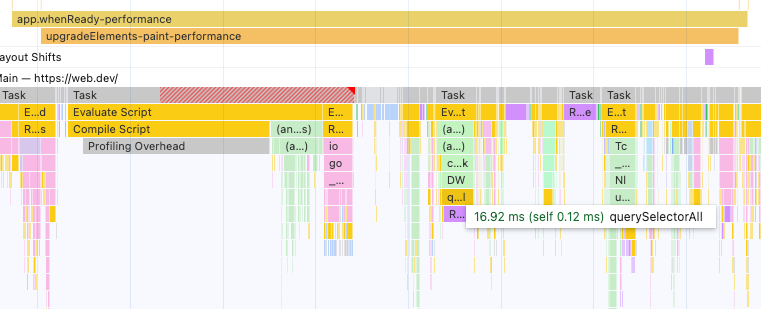 Screenshot of a website performance profile in Chrome DevTools, September 2024
Finally, if you want to optimize how different resources are loaded on your website, the DebugBear website speed test can be invaluable.
This test can provide a detailed report on what resources are loaded by your website, when they load, and how they impact rendering.
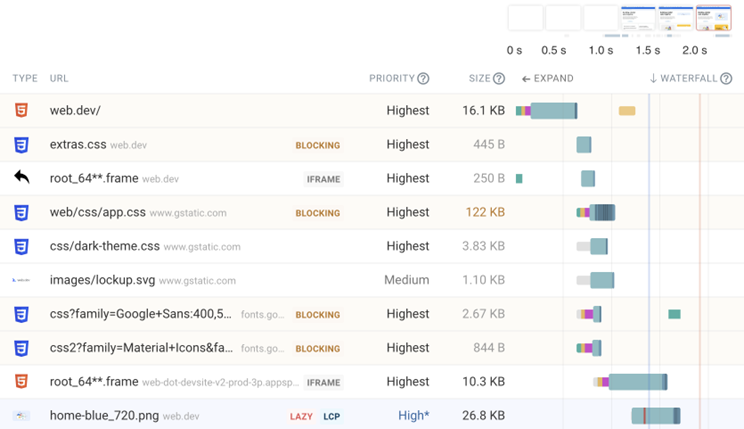 Screenshot of a website request waterfall in DebugBear, September 2024
How To Always Stay Ahead Of Your Website Speed
PageSpeed Insights and other performance tests are a great starting point for optimizing your website. However, without continuous monitoring, you risk reintroducing problems without noticing.
DebugBear is a monitoring platform for Core Web Vitals that lets you continuously test both your own website and those of your competitors.
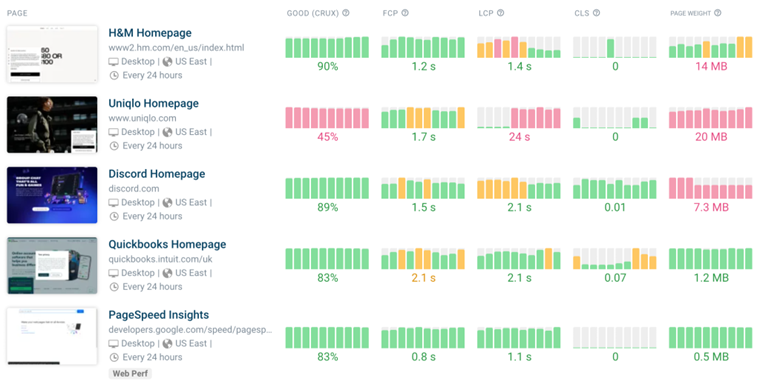 Screenshot of the DebugBear performance dashboard, September 2024
In addition to scheduled lab testing, DebugBear also keeps track of Google CrUX data and collects real user analytics directly on your website.
The real user data provides a wide range of insight to not just help you keep track of performance but actively improve it:
- See what LCP subpart is causing the biggest delay for your visitors
- Find specific interactions and scripts that cause a poor Interaction to Next Paint score
- Identify specific countries or devices where performance is worse than usual
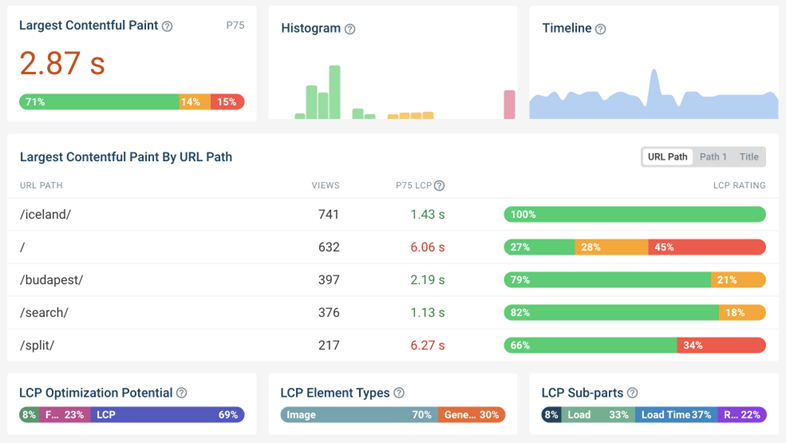 Screenshot of real user monitoring data in DebugBear, September 2024
Deliver A Great User Experience
PageSpeed Insights is a helpful tool for any website owner, not just telling you how fast your website is in the real world, but also giving you concrete advice on how to optimize it.
However, if you’d like to go beyond the data PSI provides and test your website continuously, you can sign up for a free 14-day DebugBear trial.
This article has been sponsored by DebugBear, and the views presented herein represent the sponsor’s perspective.
Ready to start optimizing your website? Sign up for DebugBear and get the data you need to deliver great user experiences.
Image Credits
Featured Image: Image by DebugBear. Used with permission.