
In this article, we’ll highlight the following:
Here are the most interesting content marketing statistics we think you should know.
- 82% of marketers are actively investing in content marketing, 10% report not using content marketing, and 8% are unsure if their company uses content marketing (HubSpot).
- 43% of B2B marketers have a documented content marketing strategy, and 60% of the most successful B2B marketers have a documented content marketing strategy (Content Marketing Institute).
- 69% of marketers actively invest time in SEO (HubSpot).
- 60% of marketers report that content marketing generates demand/leads. In addition, 70% of marketers say that content marketing helps to educate the audience, and 60% say that it helps build loyalty with existing clients/customers (CMI).
- Video is the primary form of marketing media being created in 2021, followed by blogs (used by more than half of marketing teams), then infographics (HubSpot).
- 73% of people admit to skimming blog posts, while 27% consume them thoroughly (HubSpot).
- 71% of marketers say that targeting strategic keywords is their top SEO tactic (HubSpot).
- 51% of the businesses that invest in content marketing publish content every day (The Manifest).
- Although 32% of respondents say they are overwhelmed by the amount of content available, a majority (44%) say they typically consume three to five pieces of content before engaging with a vendor (DemandGen).
- 69% of respondents prefer to learn about a product or service from a short video. 18% prefer to read a text-based article, website, or post. 4% prefer to view an infographic. 3% prefer to download an ebook or manual. 3% prefer to attend a webinar or pitch. 2% prefer to receive a sales call or demo (Wyzowl).
- 81% of marketers view content as a core business strategy (CMI).
As you can see in the previous section, most successful content marketers have a documented content strategy. Here are some statistics to inspire your strategy.
- The top 3 primary goals of creating content are boosting sales, building relationships with customers, and increasing brand awareness (eMarketer).
- Content marketing generates over 3x as many leads as outbound marketing and costs 62% less (Demand Metric).
- 72% of the most successful marketers in North America measure the ROI of their content marketing (eMarketer).
Here’s what B2B marketers say about their content marketing efforts.
- Only 4% of B2B marketers don’t plan to develop a content marketing strategy (CMI).
- 87% of B2B marketers prioritize the audience’s informational needs over the organization’s sales/promotional messages (CMI).
- Content creation is the most outsourced content marketing activity among B2B marketers (CMI).
- The top 3 organic content distribution channels used by B2B marketers are social media, email, and their organization’s blog/website (CMI).
- LinkedIn is used by 96% of B2B content marketers (CMI).
- Only 28% of B2B marketers don’t use paid content distribution channels (CMI).
- 78% of B2B marketers employ keyword research for SEO while creating content (CMI).
Let’s see how answers given by B2C content marketers compare to their B2B counterparts.
- Only 6% of B2C marketers don’t plan to develop a content marketing strategy (CMI).
- Content creation is the most outsourced content marketing activity among B2C marketers (CMI).
- The top 3 organic content distribution channels used by B2C marketers are social media, email, and their organization’s blog/website (CMI).
- The top 3 most often used content formats by B2C marketers are blog posts/short articles, email newsletters, and videos (CMI).
- B2C marketers who use at least two organic social media platforms report that Facebook (59%) and Instagram (21%) produce the best overall content marketing results (CMI).
- Only 28% of B2C marketers don’t use paid content distribution channels (CMI).
- 73% of B2C marketers employ keyword research for SEO while creating content (CMI).
As our collected statistics have already proven, most content marketers do keyword research and invest in SEO. In other words, they invest in organic search. Let’s see what else we can find about this marketing channel.
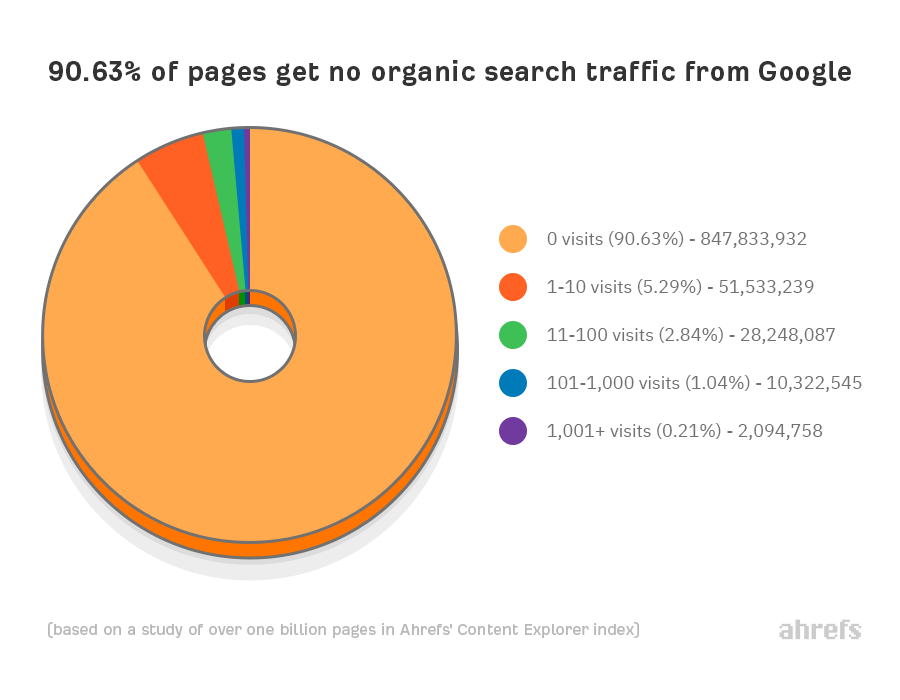
- 90.63% of pages get no organic search traffic from Google (Ahrefs).
- 68% of online experiences begin with a search engine (Brightedge).
- 71% of B2B researchers start their research with generic search instead of branded search (Google).
- 53% of shoppers say they always do research before a purchase to ensure they are making the best possible choice (Google).
- Only 5.7% of pages will rank in the top 10 search results within a year of publication (Ahrefs).
- Almost two-thirds of global online search comes from mobile devices (Perficient).
- 69% of marketers actively invest in SEO (HubSpot).
- The top 3 most often used metrics for SEO are keyword ranking, organic traffic, and time spent on page (HubSpot).
- Generally speaking, the more backlinks a page has, the more organic traffic it gets from Google (Ahrefs).
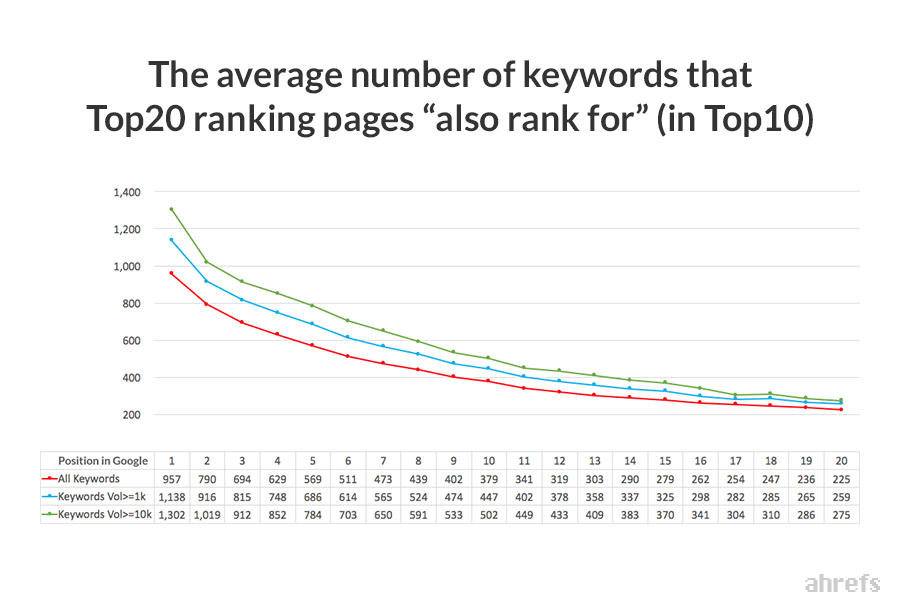
- The average #1 ranking page will also rank in the top 10 for nearly 1,000 other relevant keywords (Ahrefs).
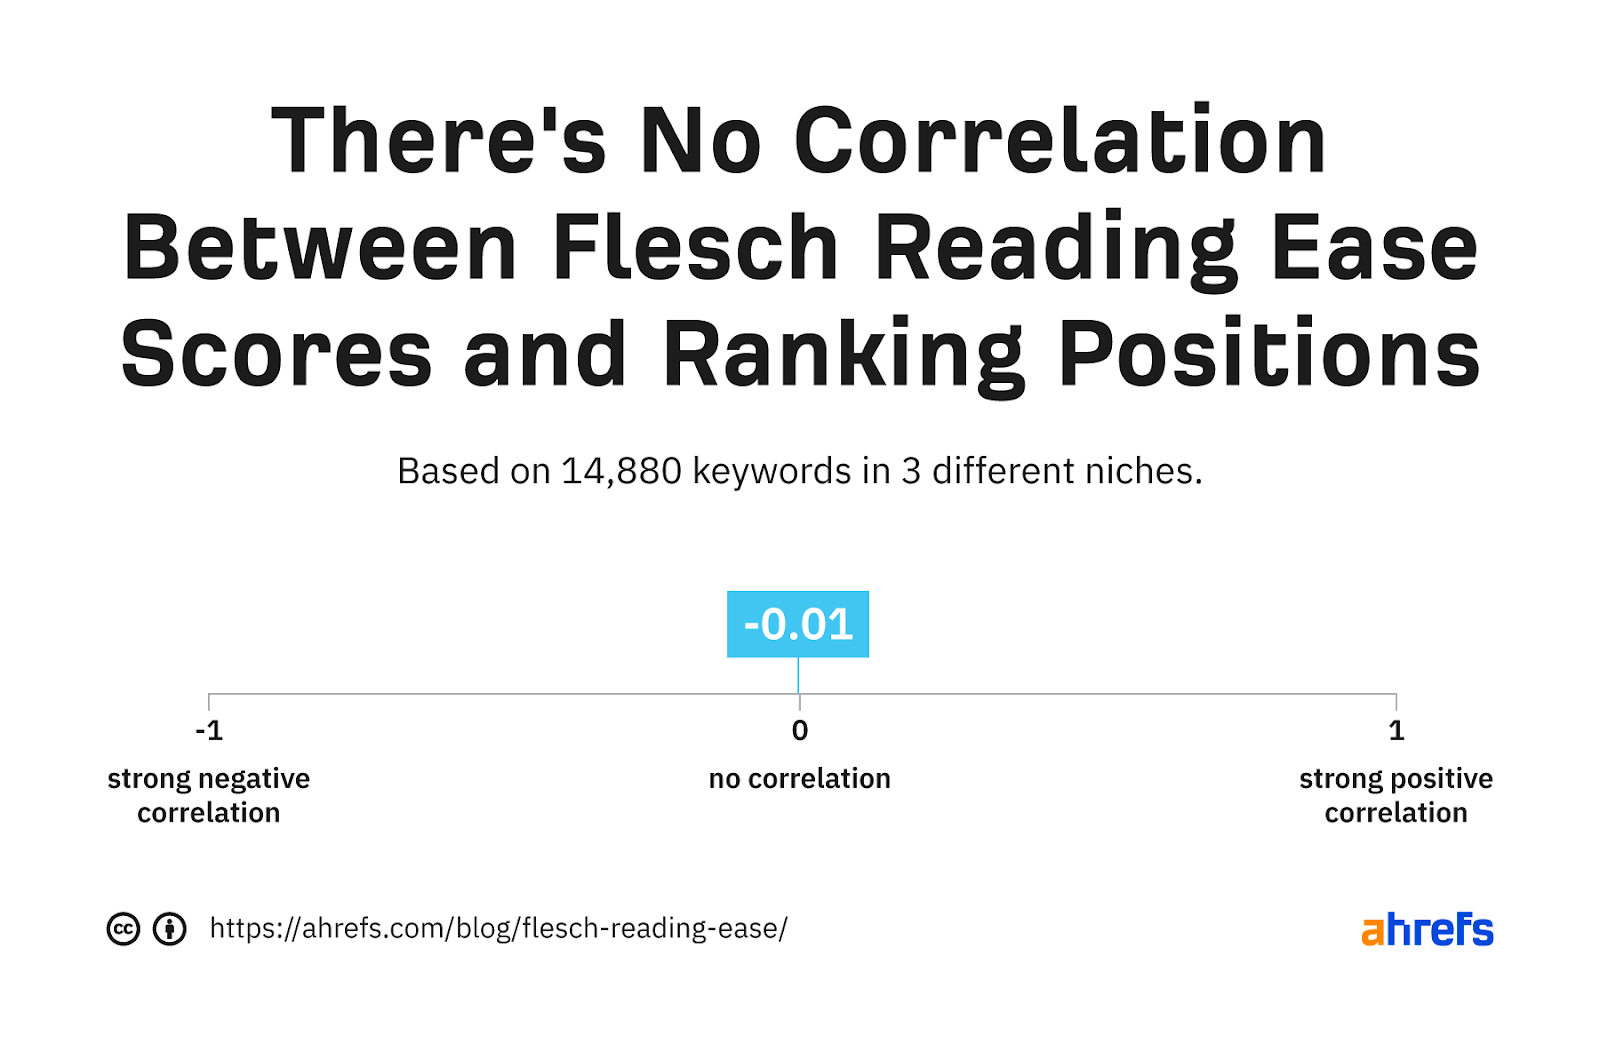
- There’s no correlation between Flesch Reading Ease scores and ranking positions (Ahrefs).
Handpicked statistics for this cornerstone of many content strategies.
- People rarely read online. They’re far more likely to scan than read word for word. They simply want to pick out the information that is most pertinent to their current needs (Nielsen).
- 70% of people rather get information from blogs than traditional advertisements (Demand Metric).
- To date, there are more than 600 million blogs out of 1.9 billion websites in the world. Their authors account for over 6 million blog posts daily, or over 2.5 billion annually (hosting tribunal).
- How-to articles are the most popular content formats (77%), followed by news and trends (49%), and guides and ebooks (47%) (Statista).
- Only one-third of bloggers regularly check their blogs’ traffic analytics (Statista).
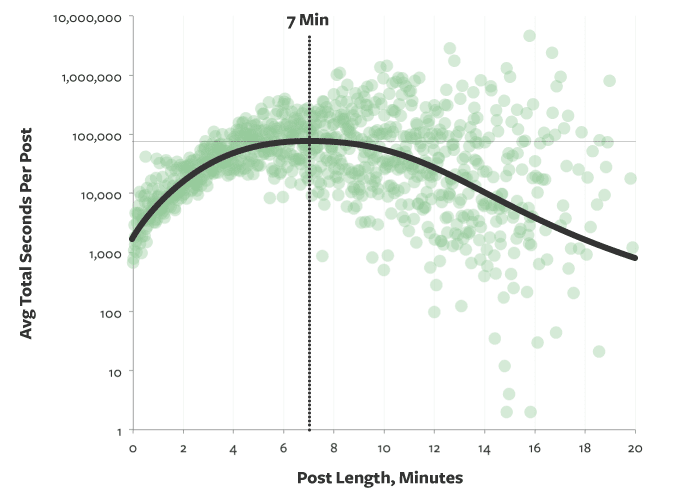
- Engagement starts to drop for posts with a reading time longer than seven minutes (Medium).
As reported by Hubspot, video is the primary form of marketing media being created in 2021. It seems that video marketing is no longer an option.
- 70% of viewers bought from a brand after seeing it on YouTube (Google).
- 79% of people say they’ve been convinced to buy or download a piece of software or app by watching a video (Wyzowl).
- 50.9% of B2B decision-makers use YouTube to research purchases (Hootsuite).
- YouTube is the second-most visited website in the U.S. by organic traffic (Ahrefs).
- YouTube reaches more 18- to 49-year-olds in an average week than all cable TV networks combined (Google).
- Video viewers say relating to their passions is 3X more important than content featuring famous actors (Google).
- Video viewers say relating to their passions is 1.6X more important than content with high production quality (Google).
- 86% of businesses use video as a marketing tool (Wyzowl).
- 91% of marketers feel the pandemic has made video more important for brands (Wyzowl).
- 96% of people have watched an explainer video to learn more about a product or service (Wyzowl).
- 85% of people want to see more videos from brands in 2021 (Wyzowl).
Brands like Slack, Shopify, and Basecamp have already invested in creating a branded podcast. These statistics show that marketers should at least consider advertising on podcasts.
- Podcast ad spending in the U.S. is expected to reach $1.74B in 2022, a 23% increase from 2021 (Statista).
- 57% of Americans listen to podcasts (Edison Research).
- 80% of podcast listeners listen to all or most of each episode (Podcast Insights).
- Weekly podcast listeners tune in to an average of 8 podcasts per week (Edison Research).
- Each week in America, there are more podcast listeners than Netflix account holders (Edison Research).
Is visual content important? Is there something like the best day to publish? How do people decide what link to click? Find out below.
- People following directions with text and illustrations do 323% better than people following directions without illustrations (W.H Levie, H.Lentz).
- The majority of marketers surveyed say that visual content is a key component of their marketing strategy. 64% say that visuals are either essential or very important. Only 9.6% don’t require visuals for their content marketing (Venngage).
- There’s no “best day” to publish a new piece of content. Social shares are distributed evenly among posts published on different days of the week (Backlinko).
- The average time a reader allocates a newsletter after opening it is only 51 seconds. Participants of the study fully read only 19% of newsletters (Nielsen).
- When deciding which links to click on the web, users choose those with the highest information scent, which is a mix of cues they get from the link label, the context in which the link is shown, and their prior experiences (Nielsen).
Final thoughts
I hope you’ve found valuable insight in the above collection of statistics. After all, it’s always a good idea to look for data-driven answers to your marketing hypotheses.
But let’s remember that it’s wise to take any statistic with a grain of salt. Statistics are generalizations of only a portion of the reality around us. Also, they aren’t methodologically sound all of the time: small sample sizes, p‑hacking, and spurious correlations are quite common.
So if you’ve just read a piece of data that contradicts your professional marketing experience, don’t throw away your content strategy just yet. Instead, dig deeper.
Finally, if you want to learn more about content marketing, we’ve got a few guides ready for you:
Got questions? Ping me on Twitter.