This post was sponsored by DebugBear. The opinions expressed in this article are the sponsor’s own.
We’ve all experienced websites that take forever to load. It’s not a great first impression!
A fast website can help you get more traffic and encourage your visitors to explore more of what you offer. (Check how fast your website is right now →)
But sometimes, once you speed up your website the first time, new user experience metrics like Interaction To Next Paint roll out.
Other times, the surprise culprit server load slows down your site when you’re not paying attention.
So, what can you do to speed up your website and stay on top of your web performance over time?
The straightforward answer: set up page speed monitoring for your website.
Why Is Page Speed Important In SEO?
Page speed and how it relates to your user’s experience is a ranking signal.
Once users have decided to open your website, it’s important to ensure the website loads quickly and provides a good experience. If users can quickly find the information they need, they are more likely to check out the rest of your website or go through your checkout flow.
Therefore, making your website fast has several benefits, helping you:
- Rank higher in Google and increase organic traffic.
- Deliver a better user experience and increase conversions.
- Reduce costs for you and your visitors.
For example, 70% of consumers say they are less likely to buy something online or return to a website if the website is slow. Google has also published a number of case studies explaining that good Core Web Vitals also lead to more sales.
How Page Speed Helps You Rank Higher On Google Search Results
Google collects page speed data from real Chrome users and uses that as a ranking signal.
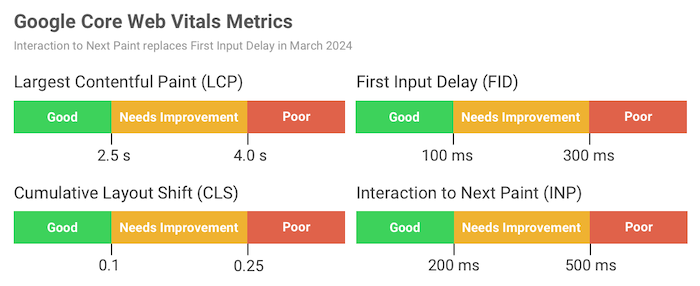
It looks at three performance metrics, called the Core Web Vitals (CWV).
Core Web Vitals are made up of:
- Largest Contentful Paint (LCP).
- Cumulative Layout Shift (CLS).
- First Input Delay (FID), which will be replaced by Interaction to Next Paint (INP) in 2024.
If at least 75% of website visitors have an experience that Google rates as “good” across all three metrics, you will get the maximum ranking benefit.
How Do You Check Core Web Vitals?
The CWV report in Google Search Console tells you if you need to optimize page experience on your website.
 A screenshot from DebugBear, August 2023
Pro Tip: Use DebugBear to measure your Core Web Vitals automatically and get actionable steps to speed up your site.
What Does Each Core Web Vital Mean?
Each CWV focuses on the speed of different aspects of your website.
Your goal is for your website to be in “Good” standing for each metric.
Largest Contentful Paint (LCP)
The LCP metric measures how quickly your website loads. Specifically, it looks at how soon after navigating to a page the biggest content element shows up, for example, a hero image or content heading.
The Largest Contentful Paint score should be 2.5 seconds or less.
Cumulative Layout Shift (CLS)
CLS measures whether the page layout is stable after content first starts to appear. If a layout shift occurs that means some page elements change place after they first show up. This provides a poor user experience, as the user needs to reorient themselves to continue reading or might accidentally click on the wrong button.
The Cumulative Layout Shift score should be lower than 0.1. It is calculated by looking at the size of the content that has shifted and the distance it has shifted by.
First Input Delay (FID) & Interaction To Next Paint (INP)
These two metrics measure how quickly your website responds to user input. When a user clicks on a button on your page, it might take a second or more for the page content to update in response to the user input, which makes the website feel laggy and unresponsive.
Interaction to Next Paint will replace First Input Delay as a Core Web Vitals metric in March 2024.
Aim for a FID score below 100 milliseconds and an INP score below 200 milliseconds.
How A Fast Website Reduces Costs
Finally, optimizing web performance may also save hosting costs for your website as less CPU processing is needed and less data needs to be downloaded, leading to lower bandwidth charges.
Many website visitors also have bandwidth limits on their mobile data plans and they may incur additional costs when going over the limit.
Step 1: Run A Website Performance Test
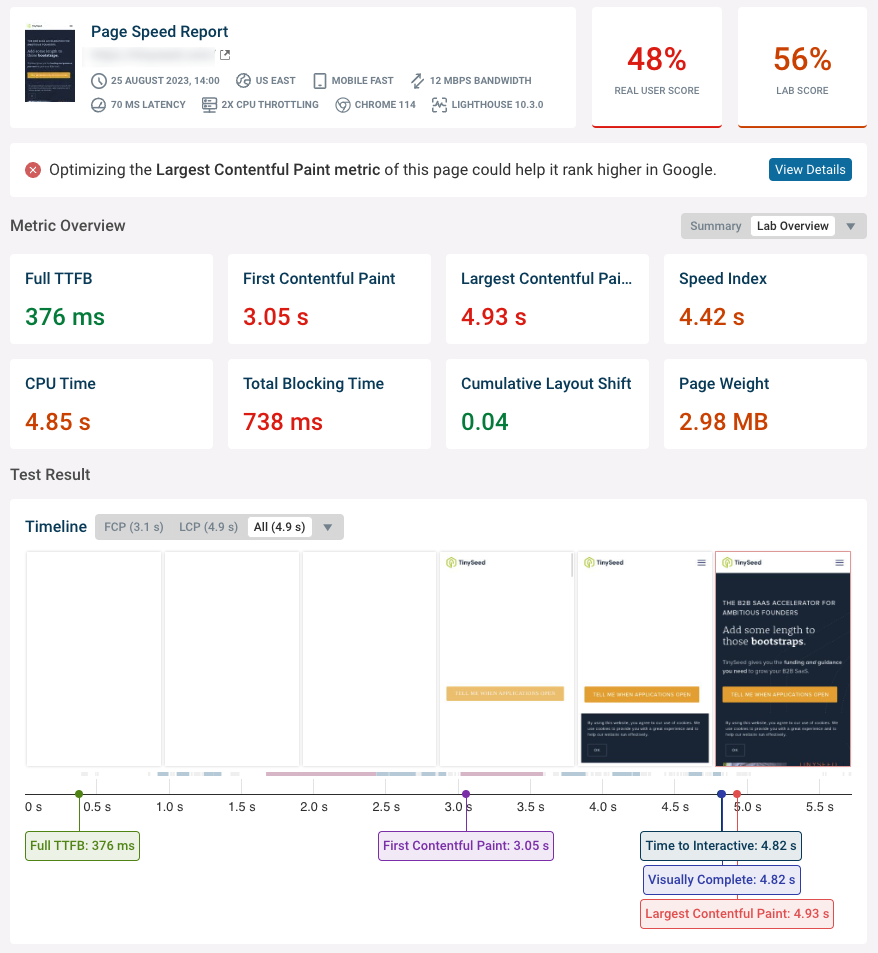
Want to see how quickly your website loads and get recommendations to speed it up? Running a free website speed test lets you assess how your website is performing now and provides a detailed report on how to improve it.
Here’s an example of what a test result looks like:
 A screenshot from DebugBear, August 2023
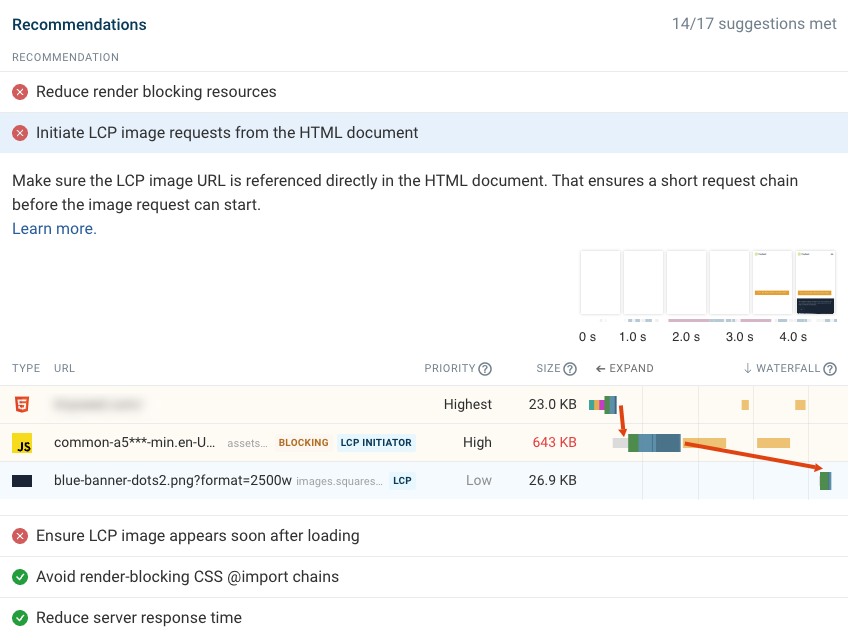
Page speed testing tools can also identify potential optimizations you can apply to your website, like reducing server response time, removing render-blocking scripts, or optimizing your images.
 A screenshot from DebugBear, August 2023
Even if you already meet Google’s CWV standards you may still benefit by optimizing further. Since Google looks at the fastest 75% of experiences there may still be a quarter of your visitors who have a suboptimal experience.
For example, some users may be on a slow mobile connection or on airplane wifi. Optimizing page speed for these users may lead to purchases you may have lost otherwise.
Step 2: Set Up Website Monitoring
Running a test on your website tells you how fast your website is now. But continuously monitoring your website and having historical data available means that you can:
- Get alerts when there’s a new performance issue.
- Check if performance optimizations have the expected impact.
- Compare test results on different days and understand the differences.
- Create reports that show your team and management how your site is doing.
Types Of Site Speed Monitoring
There are two main types of page speed data that you can monitor:
- Lab or synthetic data is collected on a schedule in a controlled testing environment.
- Field or real user data is collected from end users when they visit the website.
Lab data is more detailed and easier to collect, while real user data can show you how users are actually experiencing your website.
Synthetic Performance Tests: Benefits & Limitations
Scheduled lab-based page speed tests are easy to set up, provide detailed reporting, and can be configured both for your own sites and those of your competitors.
However, lab-based tests come with some limitations:
- User interactions after the initial page load aren’t measured (unless you’ve scripted them as part of the test setup).
- Scheduled tests are run with a consistent device configuration, like screen size and network connection speed. However, real users use a wide range of devices and experience varying network conditions.
- You only get data for the page URLs that you’ve set up monitoring for.
Some metrics like INP and CLS depend heavily on how the user interacts with the page after it’s loaded.
The content element responsible for the LCP metric also often varies based on the device. For a user with a large screen, the LCP element may be an image. On a small screen, the LCP element may be a heading, with the image appearing somewhere below the fold.
Real User Website Performance Monitoring: Benefits & Limitations
Collecting data from real users provides a number of advantages:
- It’s what ultimately matters to your visitors.
- Google uses real user data for rankings.
- You get data for the whole spectrum of user experiences: different browsers, devices, networks, and user behavior.
- Data can be collected for your whole website instead of for specific page URLs.
However, you need to make changes to your website to set up real user monitoring, and each test result will have less detail than a full lab-based test. Real user site speed data and scheduled performance tests each have their pros and cons, and they ultimately complement each other.
Step 3: Set Up Real User Monitoring
To collect data from real users you need to install an analytics snippet on your website from the website monitoring tool of your choice.
Pro Tip: You can sign up for a free DebugBear trial to get started.
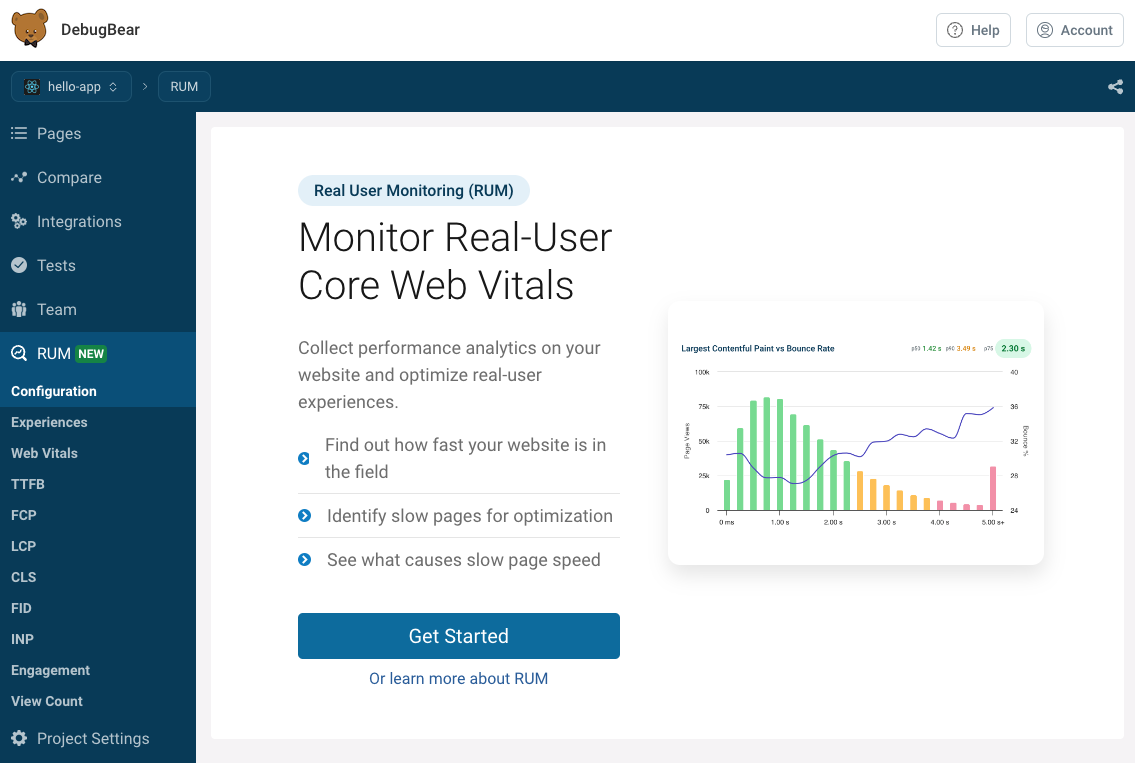
Once your account is set up, switch to the “RUM” tab and click “Get Started”.
 A screenshot from DebugBear, August 2023
This will generate an embed code that you need to install on your website. You can add it to the HTML template of your website, or install it via a tag manager tool like Google Tag Manager.
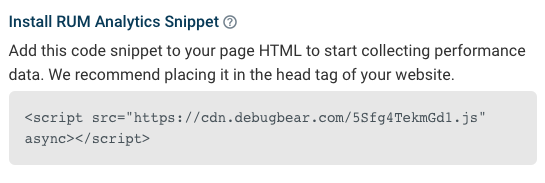 A screenshot from DebugBear, August 2023
Once this is set up you’ll start to see real-world Core Web Vitals experiences for your website.
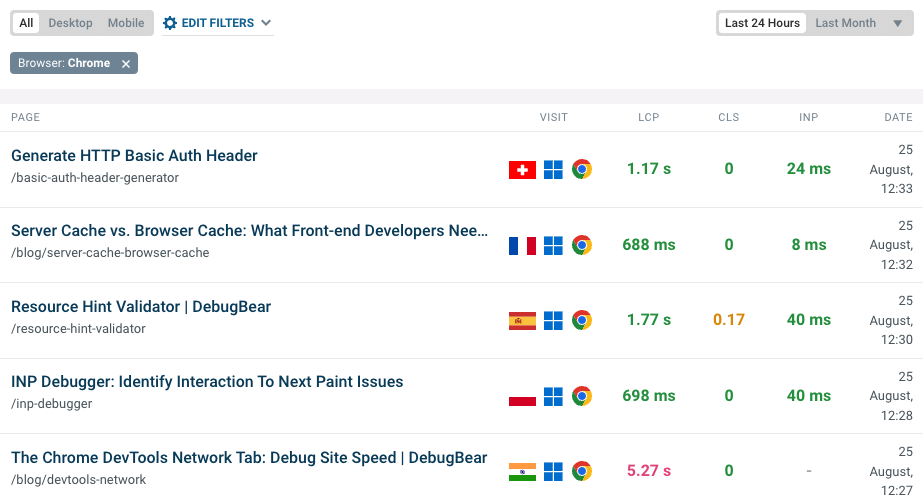 A screenshot from DebugBear, August 2023
You can also see where in the world users have a good experience and where your site loads more slowly.
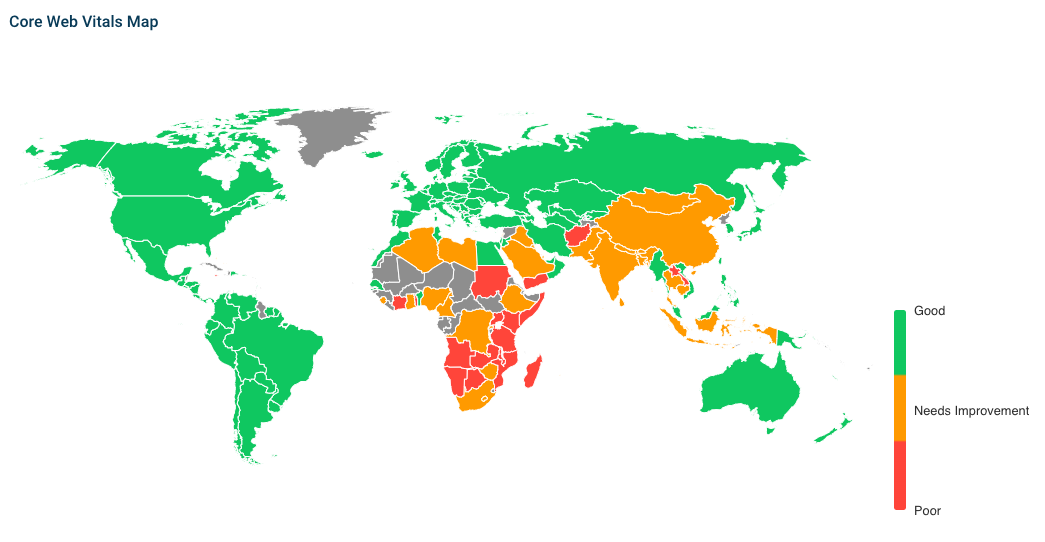 A screenshot from DebugBear, August 2023
Step 4: Use Real User Data To Pinpoint Specific Performance Metrics
If your website isn’t doing well on one of the Core Web Vitals metrics you can dive more deeply into this issue.
DebugBear provides metric-specific dashboards that show you:
- Which of your pages are fast and which are slow.
- The distribution of user experiences.
- Whether a typical user experience is fast or slow.
- How page speed has changed over time, both for the average user and for the slowest 10% of user experiences.
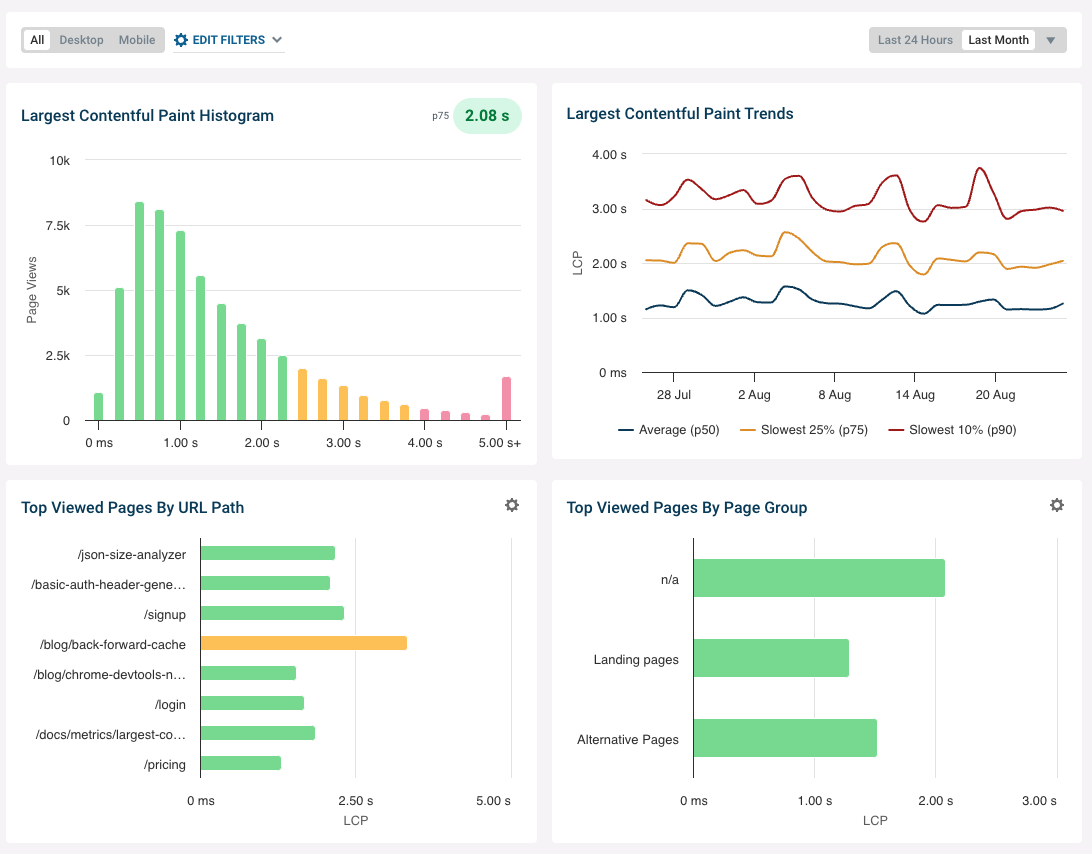 A screenshot from DebugBear, August 2023
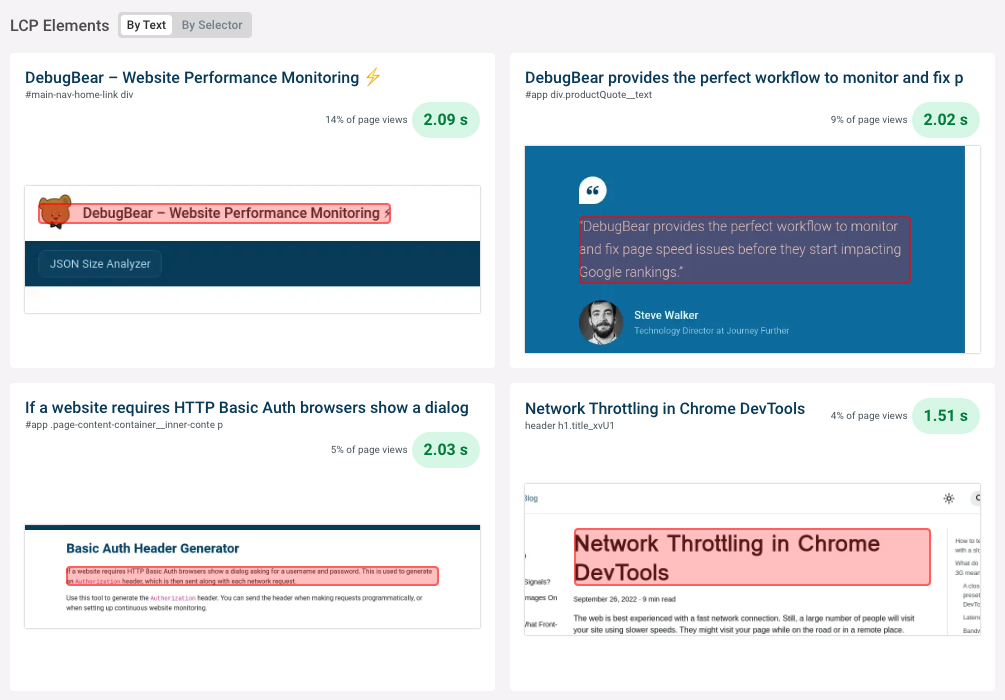
When debugging the LCP it’s also important to know which page element was the biggest piece of content for different users. DebugBear shows a breakdown of these elements and how long users need to wait for it to appear.
That way you can identify what page optimizations would have the biggest impact on the largest number of users.
 A screenshot from DebugBear, August 2023
The same applies to INP where you need to know what page interaction led to an interaction delay for the user.
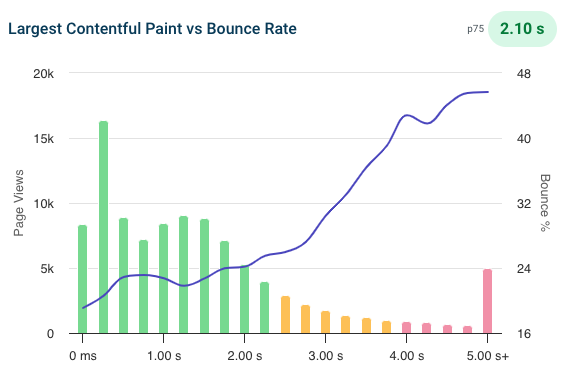
Finally, DebugBear can also report to you how page speed metrics correlate with other metrics like bounce rate:
 A screenshot from DebugBear, August 2023
How Real User Monitoring Is Different From Google’s Chrome User Experience Report (CrUX)
Whether you own analytics or look at Google data, in both cases you’re working with real user metrics.
Why not just rely on the Google data exclusively?
- Google provides data that’s aggregated over a 28-day period, so after a change on your website, it takes a long time to see the effect.
- CrUX data is only available for pages that reach a minimum traffic volume.
- Google only collects data from users who are logged into their Google account in Chrome.
Step 5: Continuously Run Page Speed Tests
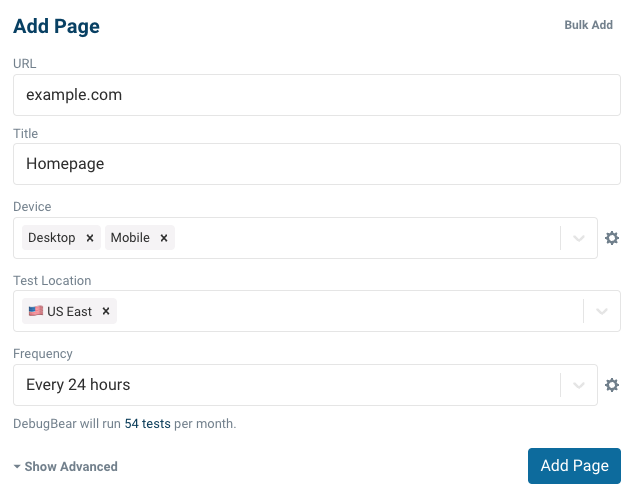
The DebugBear website monitoring service can run performance tests on a schedule, whether that’s hourly, daily, or weekly.
To get started, simply enter your website URL and pick a test location, test device, and monitoring schedule.
 A screenshot from DebugBear, August 2023
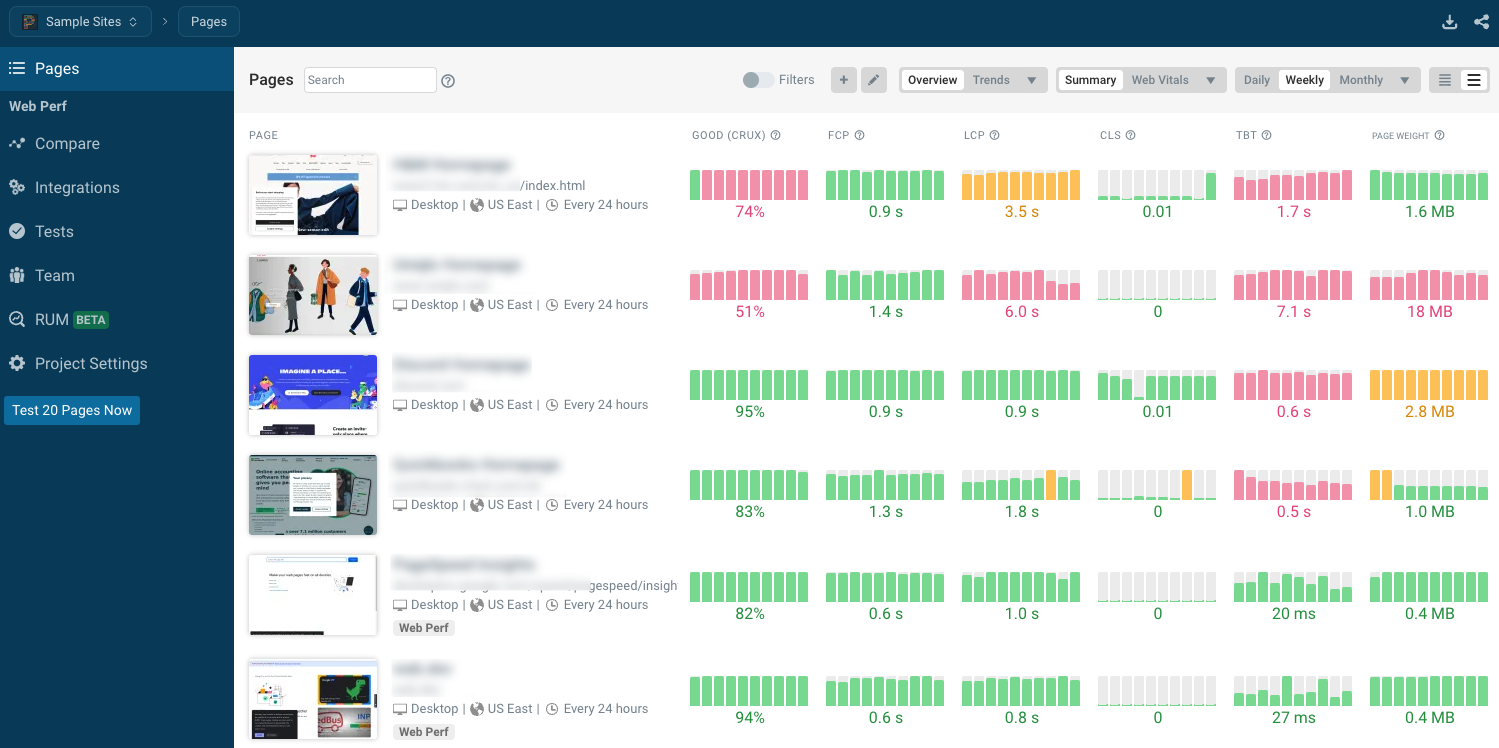
Once you’ve set up monitoring, a dashboard will tell you how your website has been doing on the CWV metrics of the last few weeks.
You can also monitor competitor sites to see how your site speed compares.
 A screenshot from DebugBear, August 2023
For each monitored page you also get a page-specific dashboard with performance trends for that specific URL and a detailed analysis of each speed metric.
For example, in the screenshot below you can see:
- How the Largest Contentful Paint metric has changed over time.
- The image element that is responsible for triggering the LCP milestone.
- What network requests are involved in loading the image (called a request waterfall visualization).
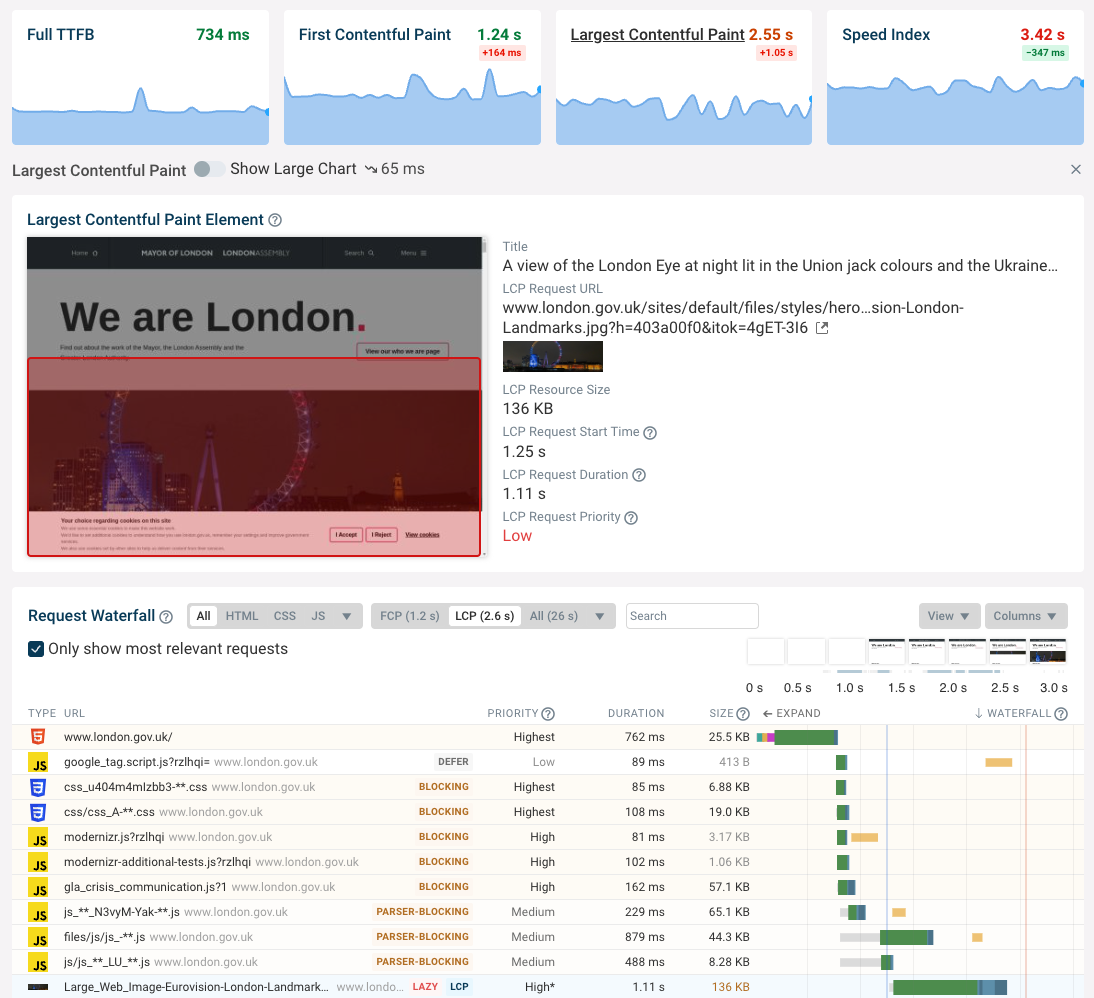 A screenshot from DebugBear, August 2023
In addition to running its own performance tests, DebugBear also continuously checks the real user data that Google uses for rankings. This data comes from the Chrome User Experience Report, or CrUX for short.
We can see that on this page more than 86% of visitors are having a good experience.
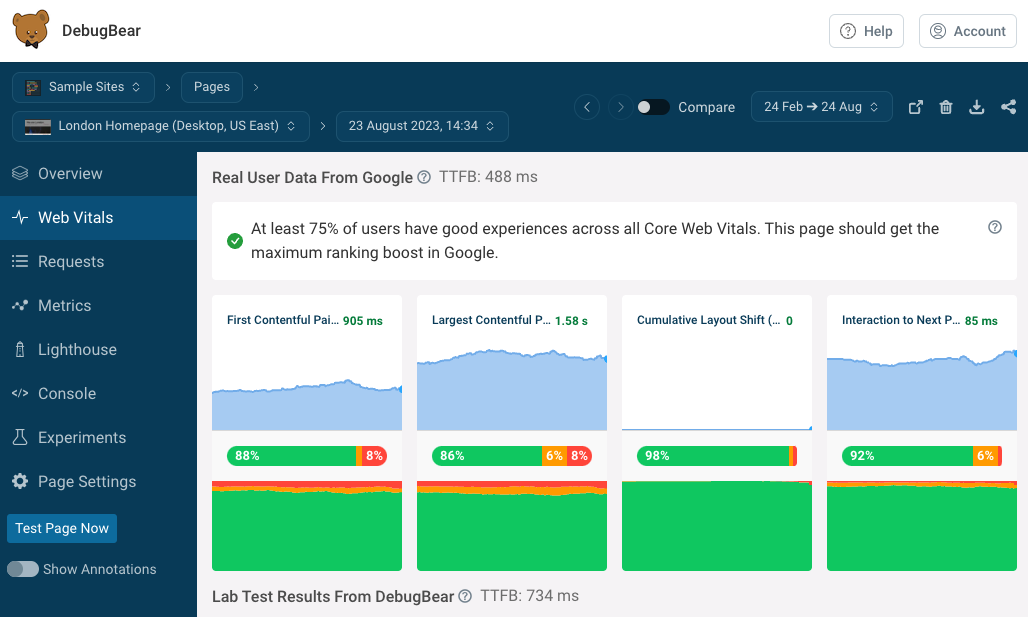 A screenshot from DebugBear, August 2023
Step 6: Set Up Alerts If Web Performance Drops
Even if you have a fast website you’ll still run into performance issues from time to time. For example after:
- Uploading a new image to a landing page.
- Installing a new third-party script.
- Changing a configuration option in your hosting setup.
- Gradual growth of your database size.
DebugBear can send regression alerts via email, Slack, or Microsoft Teams.
To avoid noisy alerts all tests are re-run if they would trigger an issue. That way notifications are only sent for reproducible issues.
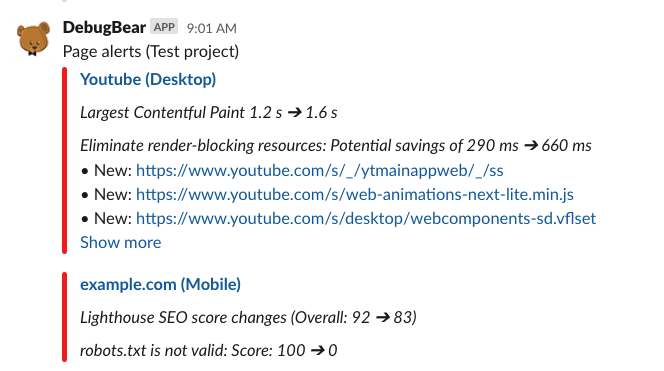 A screenshot from DebugBear, August 2023
As you can see from the alert above DebugBear also runs a Google Lighthouse audit audit with each test, including the accessibility and SEO scores. That way basic accessibility and SEO monitoring are also included.
Step 7: Compare Speed Test Results
Okay, so you’ve received a web performance alert and see a change in your metrics. What next?
DebugBear offers a compare mode that lets you compare test results before and after a regression to see exactly what changed and how it’s impacting users.
The screenshot below shows an example where a new third-party script was added to a website and visitors now wait much longer for page content to show up.
Once you know what’s causing the issue you can decide how to proceed. You could:
- Roll back the change.
- Load the script asynchronously so it doesn’t delay rendering.
- Optimize the script so it’s smaller and faster to download.
- Load the script from your own domain to avoid having to establish a server connection to the third-party website.
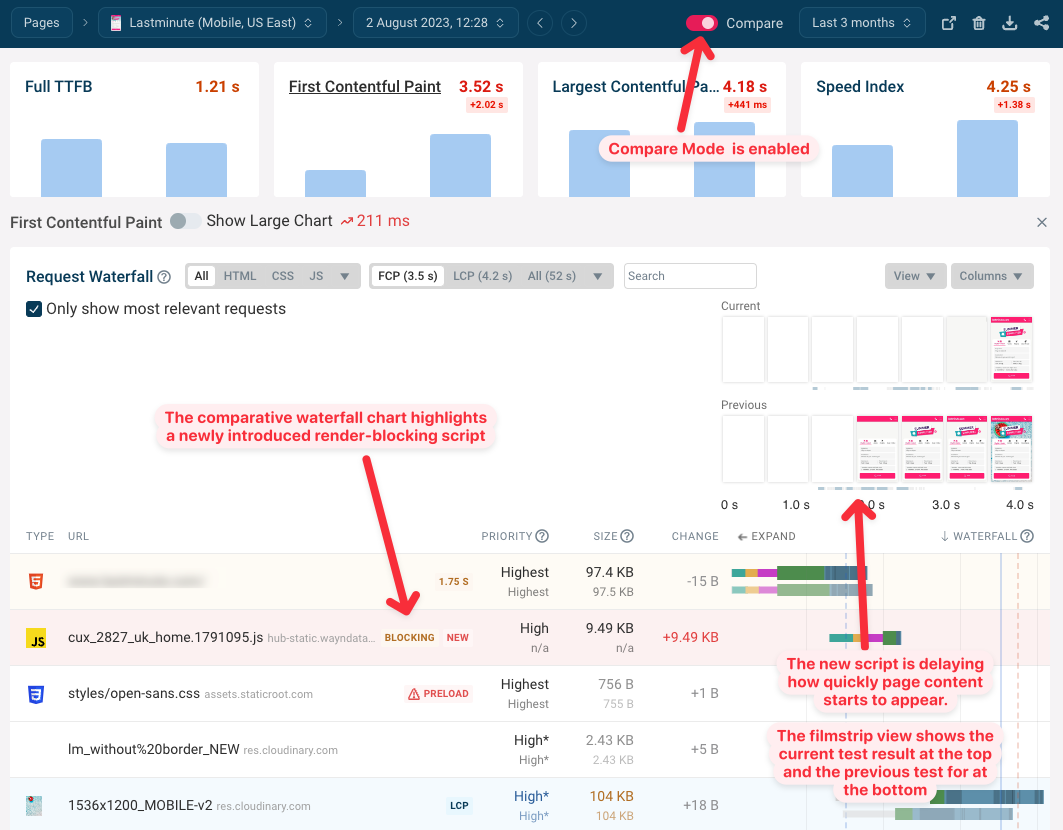 A screenshot from DebugBear, August 2023
The comparison tool is also a great way to visually communicate a regression or the impact of a successful performance optimization.
DebugBear offers both a filmstrip view that shows each rendering frame of the website one by one, and a video view that shows how a real user would experience the loading speed before and after a change. You can export this visualization as an MP4 video file and embed it in team or client presentations.
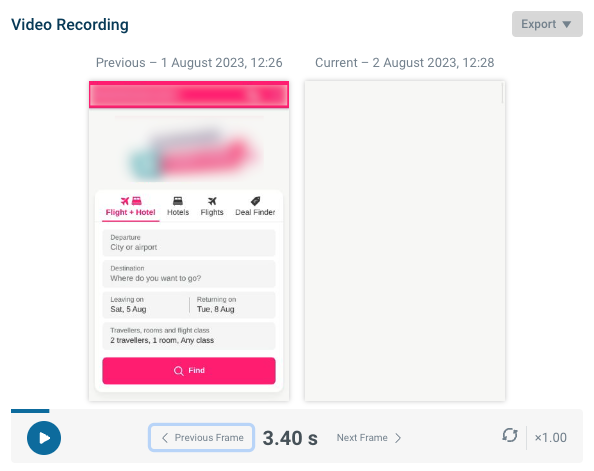 A screenshot from DebugBear, August 2023
Stay On Top Of Your Core Web Vitals
Ready to start prioritizing your website performance, rank higher in Google, and deliver a better user experience? Try DebugBear for free for 14 days.
The free trial lets you:
- Test how your website performs right now.
- Get recommendations to optimize page speed.
- Find out quickly when your page speed changes.
- See how real users experience your website.
Image Credits
Featured Image: Image by DebugBear. Used with permission.
