BigQuery has a number of advantages not found with other tools when it comes to analyzing large volumes of Google Search Console (GSC) data.
It lets you process billions of rows in seconds, enabling deep analysis across massive datasets.
This is a step up from Google Search Console, which only allows you to export 1,000 rows of data and may have data discrepancies.
You read all about why you should be using BigQuery as an SEO pro. You figured out how to plug GSC with BigQuery. Data is flowing!
Now what?
It’s time to start querying the data. Understanding and effectively querying the data is key to gaining actionable SEO insights.
In this article, we’ll walk through how you can get started with your queries.
Understanding GSC Data Structure In BigQuery
Data is organized in tables. Each table corresponds to a specific Google Search Console report. The official documentation is very extensive and clear.
However, if you are reading this, it’s because you want to understand the context and the key elements before diving into it.
Taking the time to figure this out means that you will be able to create better queries more efficiently while keeping the costs down.
GSC Tables, Schema & Fields In BigQuery
Schema is the blueprint that maps what each field (each piece of information) represents in a table.
You have three distinct schemas presented in the official documentation because each table doesn’t necessarily hold the same type of data. Think of tables as dedicated folders that organize specific types of information.
Each report is stored separately for clarity. You’ve got:
- searchdata_site_impression: Contains performance data for your property aggregated by property.
- searchdata_url_impression: Contains performance data for your property aggregated by URL.
- exportLog: each successful export to either table is logged here.
A few important notes on tables:
- You’ll find in the official documentation that things don’t run the way we expect them to: “Search Console exports bulk data once per day, though not necessarily at the same time for each table.”
- Tables are retained forever, by default, with the GSC bulk export.
- In the URL level table (searchdata_url_impression), you have Discover data. The field is_anonymized_discover specifies if the data row is subject to the Discover anonymization threshold.
Fields are individual pieces of information, the specific type of data in a table. If this were an Excel file, we’d refer to fields as the columns in a spreadsheet.
If we’re talking about Google Analytics, fields are metrics and dimensions. Here are key data fields available in BigQuery when you import GSC data:
- Clicks – Number of clicks for a query.
- Impressions – Number of times a URL was shown for a query.
- CTR – Clickthrough rate (clicks/impressions).
- Position – Average position for a query.
Let’s take the searchdata_site_impression table schema as an example. It contains 10 fields:
| Field | Explanation |
| data_date | The day when the data in this row was generated, in Pacific Time. |
| site_url | URL of the property, sc-domain:property-name or the full URL, depending on your validation. |
| query | The user’s search query. |
| is_anonymized_query | If true, the query field will return null. |
| country | Country from which the search query originated. |
| search_type | Type of search (web, image, video, news, discover, googleNews). |
| device | The device used by the user. |
| impressions | The number of times a URL was shown for a particular search query. |
| clicks | The number of clicks a URL received for a search query. |
| sum_top_position | This calculation figures out where your website typically ranks in search results. It looks at the highest position your site reaches in different searches and calculates the average. |
Putting It Together
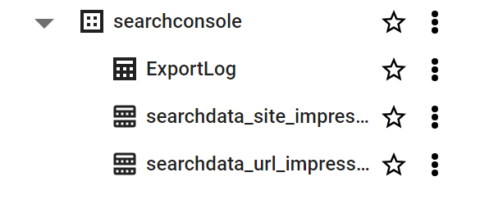
In BigQuery, the dataset for the Google Search Console (GSC) bulk export typically refers to the collection of tables that store the GSC data.
The dataset is named “searchconsole” by default.
Unlike the performance tab in GSC, you have to write queries to ask BigQuery to return data. To do that, you need to click on the “Run a query in BigQuery” button.
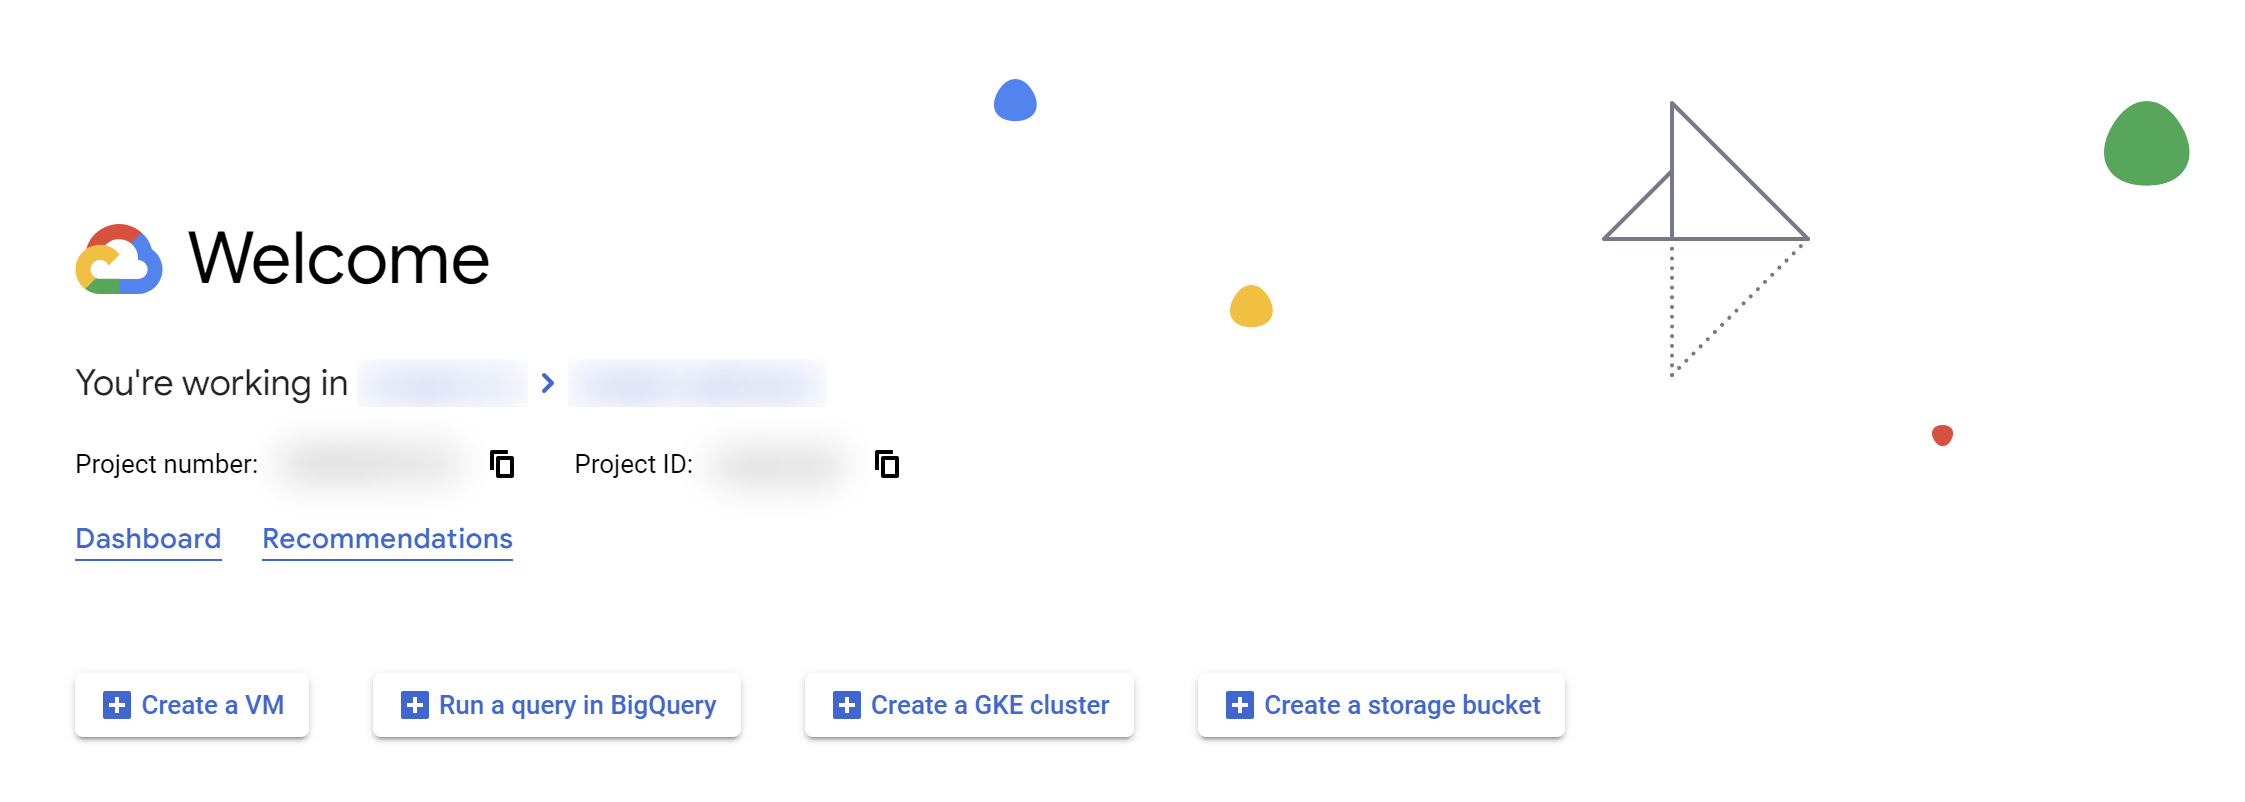 Screenshot from Google Cloud Console, January 2024
Once you do that, you should have access to the BigQuery Studio, where you will be creating your first SQL query. However, I don’t recommend you click on that button yet.
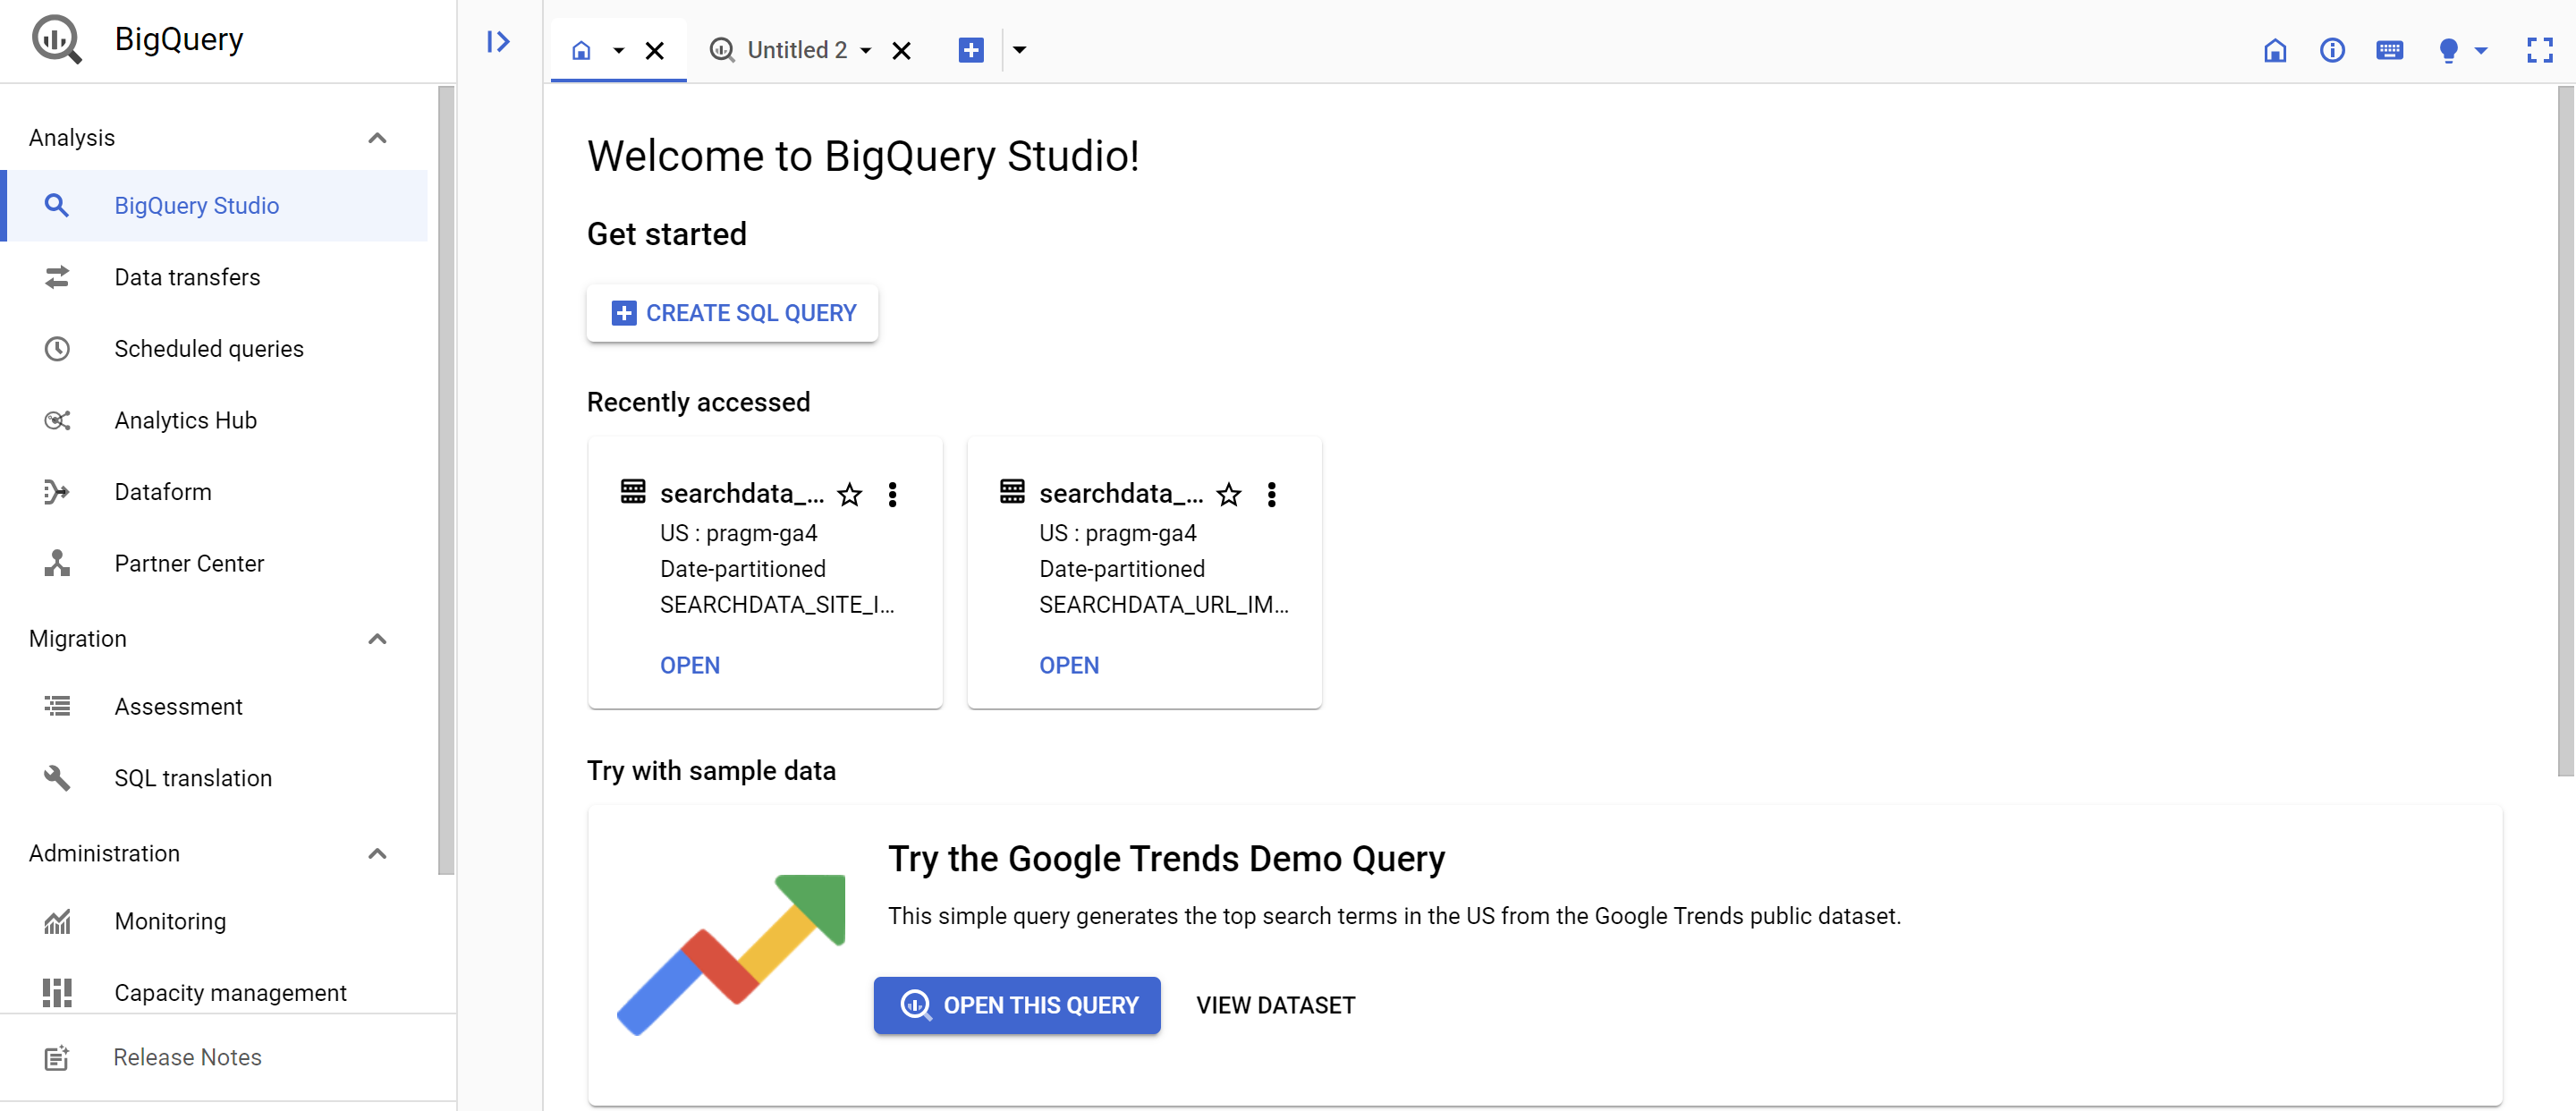 Screenshot of BigQuery Studio, January 2024
In Explorer, when you open your project, you will see the datasets; it’s a logo with squares with dots in them. This is where you see if you have GA4 and GSC data, for instance.
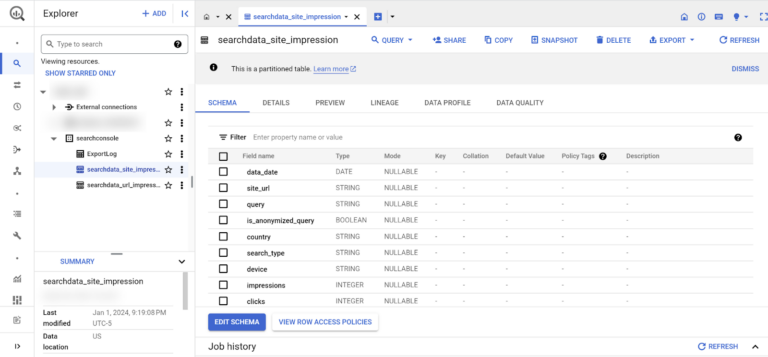
When you click on the tables, you get access to the schema. You can see the fields to confirm this is the table you want to query.
If you click on “QUERY” at the top of the interface, you can create your SQL query. This is better because it loads up some information you need for your query.
It will fill out the FROM with the proper table, establish a default limit, and the date that you can change if you need to.
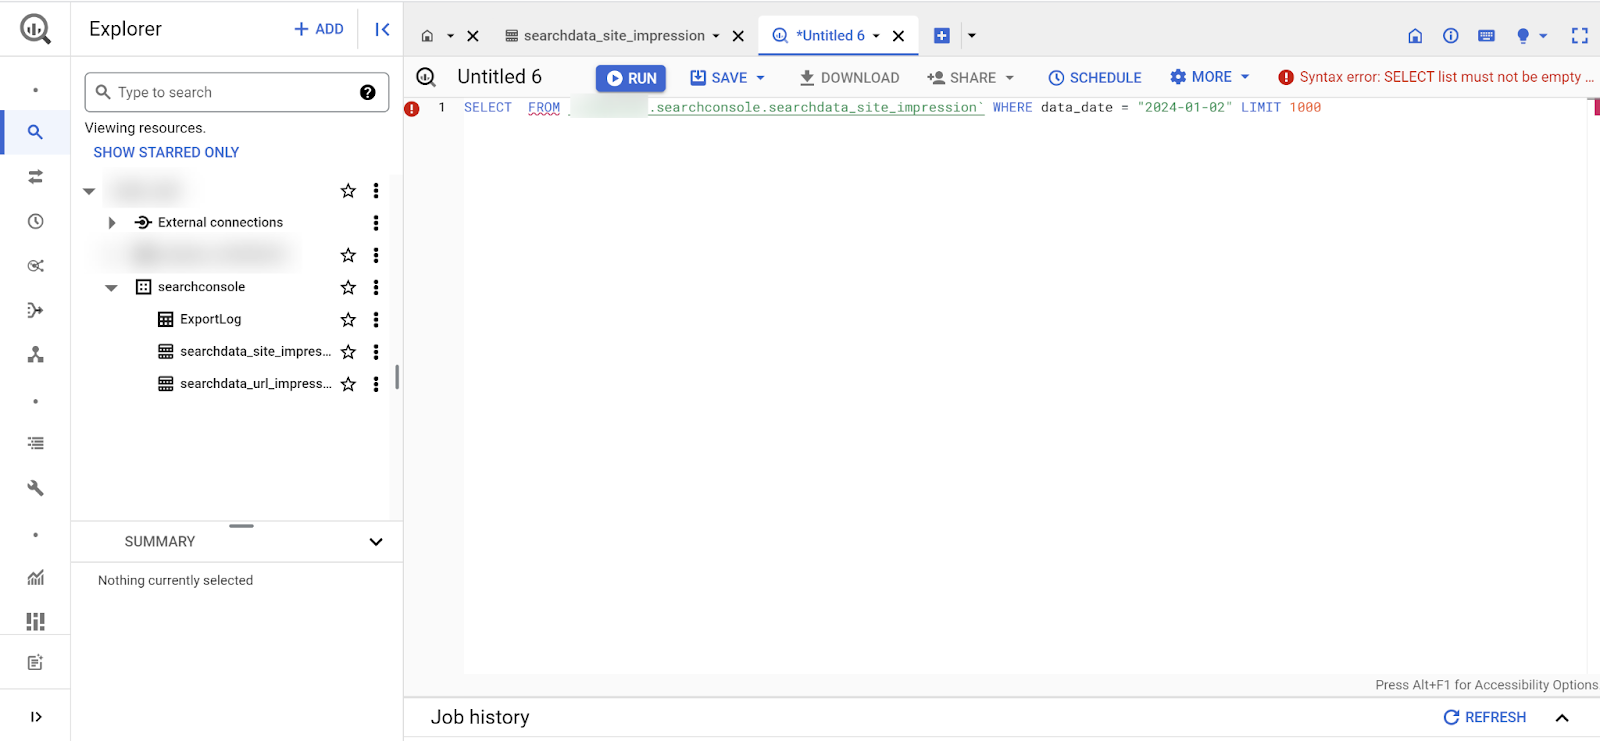 Screenshot from Google Cloud Console, January 2024
Getting Started With Your First Query
Search Console > BigQuery export was previously only available to companies with devs/ a super techy SEO. Now it’s available to everyone!
Writing SQL is a more and more important skill for marketers & I’m making something to help with that – if you’d like to test it DM me 🙂 https://t.co/voOESJfo1e
— Robin Lord (@RobinLord8) February 21, 2023
The queries we are going to discuss here are simple, efficient, and low-cost.
Disclaimer: The previous statement depends on your specific situation.
Sadly, you cannot stay in the sandbox if you want to learn how to use BigQuery with GSC data. You must enter your billing details. If this has you freaked out, fear not; costs should be low.
- The first 1 TiB per month of query data is free.
- If you have a tight budget, you can set cloud billing budget alerts — you can set a BigQuery-specific alert and get notified as soon as data usage charges occur.
In SQL, the ‘SELECT *’ statement is a powerful command used to retrieve all columns from a specified table or retrieve specific columns as per your specification.
This statement enables you to view the entire dataset or a subset based on your selection criteria.
A table comprises rows, each representing a unique record, and columns, storing different attributes of the data. Using “SELECT *,” you can examine all fields in a table without specifying each column individually.
For instance, to explore a Google Search Console table for a specific day, you might employ a query like:
SELECT *
FROM `yourdata.searchconsole.searchdata_site_impression`
WHERE data_date="2023-12-31"
LIMIT 5;
You always need to make sure that the FROM clause specifies your searchdata_site_impression table. That’s why it is recommended to start by clicking the table first, as it automatically fills in the FROM clause with the right table.
Important: We limit the data we load by using the data_date field. It’s a good practice to limit costs (along with setting a limit).
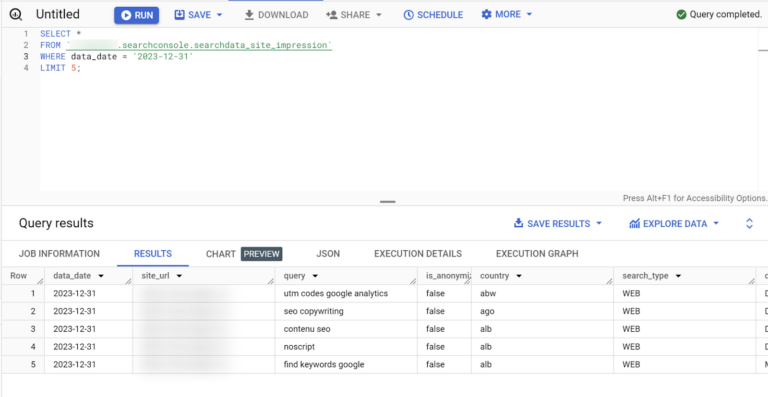
Your First URL Impression Query
If you want to see information for each URL on your site, you’d ask BigQuery to pull information from the ‘searchdata_url_impression’ table, selecting the ‘query’ and ‘clicks’ fields.
This is what the query would look like in the console:
SELECT
url,
SUM(clicks) AS clicks,
SUM(impressions)
FROM
`yourtable.searchdata_url_impression`
WHERE
data_date = ‘2023-12-25’
GROUP BY
url
ORDER BY
clicks DESC
LIMIT
100
You always need to make sure that the FROM clause specifies your searchdata_url_impression table.
When you export GSC data into BigQuery, the export contains partition tables. The partition is the date.
This means that the data in BigQuery is structured in a way that allows for quick retrieval and analysis based on the date.
That’s why the date is automatically included in the query. However, you may have no data if you select the latest date, as the data may not have been exported yet.
Breakdown Of The Query
In this example, we select the URL, clicks, and impressions fields for the 25th of December, 2023.
We group the results based on each URL with the sum of clicks and impressions for each of them.
Lastly, we order the results based on the number of clicks for each URL and limit the number of rows (URLs) to 100.
Recreating Your Favorite GSC Report
I recommend you read the GSC bulk data export guide. You should be using the export, so I will not be providing information about table optimization. That’s a tad bit more advanced than what we are covering here.
GSC’s performance tab shows one dimension at a time, limiting context. BigQuery allows you to combine multiple dimensions for better insights
Using SQL queries means you get a neat table. You don’t need to understand the ins and outs of SQL to make the best use of BigQuery.
This query is courtesy of Chris Green. You can find some of his SQL queries in Github.
SELECT
query,
is_anonymized_query AS anonymized,
SUM(impressions) AS impressions,
SUM(clicks) AS clicks,
SUM(clicks)/NULLIF(SUM(impressions), 0) AS CTR
FROM
yourtable.searchdata_site_impression
WHERE
data_date >= DATE_SUB(CURRENT_DATE(), INTERVAL 28 DAY)
GROUP BY
query,
anonymized
ORDER BY
clicks DESC
This query provides insights into the performance of user queries over the last 28 days, considering impressions, clicks, and CTR.
It also considers whether the queries are anonymized or not, and the results are sorted based on the total number of clicks in descending order.
This recreates the data you would normally find in the Search Console “Performance” report for the last 28 days of data, results by query, and differentiating anonymized queries.
Feel free to copy/paste your way to glory, but always make sure you update the FROM clause with the right table name. If you are curious to learn more about how this query was built, here is the breakdown:
- SELECT clause:
- query: Retrieves the user queries.
- is_anonymized_query AS anonymized: Renames the is_anonymized_query field to anonymized.
- SUM(impressions) AS impressions: Retrieves the total impressions for each query.
- SUM(clicks) AS clicks: Retrieves the total clicks for each query.
- SUM(clicks)/NULLIF(SUM(impressions), 0) AS CTR: Calculates the Click-Through Rate (CTR) for each query. The use of NULLIF prevents division by zero errors.
- FROM clause:
- Specifies the source table as mytable.searchconsole.searchdata_site_impression.
- WHERE clause:
- Filters the data to include only rows where the data_date is within the last 28 days from the current date.
- GROUP BY clause:
- Groups the results by query and anonymized. This is necessary since aggregations (SUM) are performed, and you want the totals for each unique combination of query and anonymized.
- ORDER BY clause:
- Orders the results by the total number of clicks in descending order.
Handling The Anonymized Queries
According to Noah Learner, the Google Search Console API delivers 25 times more data than the GSC performance tab for the same search, providing a more comprehensive view.
In BigQuery, you can also access the information regarding anonymized queries.
It doesn’t omit the rows, which helps analysts get complete sums of impressions and clicks when you aggregate the data.
Understanding the volume of anonymized queries in your Google Search Console (GSC) data is key for SEO pros.
When Google anonymizes a query, it means the actual search query text is hidden in the data. This impacts your analysis:
- Anonymized queries remove the ability to parse search query language and extract insights about searcher intent, themes, etc.
- Without the query data, you miss opportunities to identify new keywords and optimization opportunities.
- Not having query data restricts your capacity to connect search queries to page performance.
The First Query Counts The Number Of Anonymized Vs. Not Anonymized Queries
SELECT
CASE
WHEN query is NULL AND is_anonymized_query = TRUE THEN "no query"
ELSE
"query"
END
AS annonymized_query,
count(is_anonymized_query) as query_count
FROM
`yourtable.searchdata_url_impression`
GROUP BY annonymized_query
Breakdown Of The Query
In this example, we use a CASE statement in order to verify for each row if the query is anonymized or not.
If so, we return “no query” in the query field; if not, “query.”
We then count the number of rows each query type has in the table and group the results based on each of them. Here’s what the result looks like:

Advanced Querying For SEO Insights
BigQuery enables complex analysis you can’t pull off in the GSC interface. This means you can also create customized intel by surfacing patterns in user behavior.
You can analyze search trends, seasonality over time, and keyword optimization opportunities.
Here are some things you should be aware of to help you debug the filters you put in place:
- The date could be an issue. It may take up to two days for you to have the data you want to query. If BigQuery says on the top right corner that your query would require 0mb to run, it means the data you want isn’t there yet or that there is no data for your query.
- Use the preview if you want to see what a field will return in terms of value. It shows you a table with the data.
- The country abbreviations you will get in BigQuery are in a different format (ISO-3166-1-Alpha-3 format) than you are used to. Some examples: FRA for France, UKR for Ukraine, USA for the United States, etc.
- Want to get “pretty” queries? Click on “more” within your query tab and select “Format query.” BigQuery will handle that part for you!
- If you want more queries right away, I suggest you sign up for the SEOlytics newsletter, as there are quite a few SQL queries you can use.
Conclusion
Analyzing GSC data in BigQuery unlocks transformative SEO insights, enabling you to track search performance at scale.
By following the best practices outlined here for querying, optimizing, and troubleshooting, you can get the most out of this powerful dataset.
Reading this isn’t going to make you an expert instantly. This is the first step in your adventure!
If you want to know more, check out Jake Peterson’s blog post, start practicing for free with Robin Lord’s Lost at SQL game, or simply stay tuned because I have a few more articles coming!
If you have questions or queries, do not hesitate to let us know.
More resources:
Featured Image: Tee11/Shutterstock
