Many people talk about how important it is to have a “low bounce rate.”
But bounce rate is one of the most misunderstood metrics in SEO and digital marketing.
This article will explore the complexities of bounce rate and why it’s not as straightforward as you might think.
You’ll also learn how to analyze your bounce using Google Analytics 4 exploration reports.
In order to understand what bounce rate is, we need to define what engaged sessions are according to GA4.
What Is An Engaged Session?
An engaged session in GA4 is a session which meets either of the following criteria:
- Lasts at least 10 seconds.
- Has key event (formerly conversions).
- Has at least two screen views (or pageviews).
Simply put, if a user lands on your homepage and leaves without converting (key event), that would produce a 100 percent bounce rate for that session.
If one lands and visits a second page or signs up for your newsletter (as you defined it as a key event), that would mean the bounce rate for that session is 0%.
What Is Bounce Rate In Google Analytics?
Bounce rate is a percentage of unengaged sessions, and it is calculated with the following formula:
(total sessions/unengaged sessions)*100.
So, it’s not only visiting a second page that brings the bounce rate down but also when key events occur.
You can set up any event, either built-in or custom-defined in Google Analytics 4 (GA4), to count as a key event (formerly conversion), and in cases when it occurs during the session, it will be counted as a non-bounce visit.
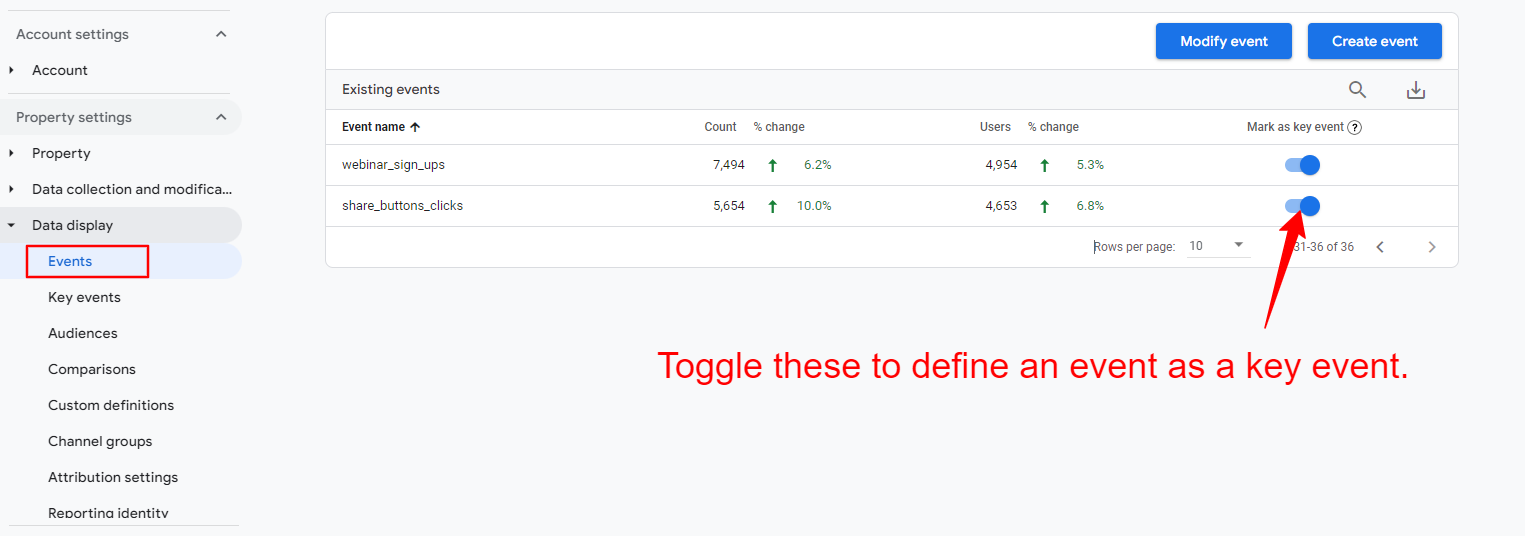
Here is how to define any event as a key event:
- Navigate to Admin.
- Under Data display, navigate to Events.
- Find the event you are interested in and toggle Mark as key event to turn it blue.
-
 How to mark events as key events in GA.
How To Change The Default Engaged Session Timer In GA4
As a marketer, you may want to adjust the default 10-second timer for engaged sessions based on your project needs.
For example, if you have a blog article, you may want to set the timer as high as 20 seconds, but if you have a product page where users typically take more time to explore details, you might increase the timer to 30 seconds to better reflect user engagement.
To change:
- Navigate to Data streams and click on the stream.
- In the slide popup, navigate to Configure tag settings.
- In the second slide popup, click Show more at the bottom.
- Click on the Adjust session timeout setting.
- Change Adjust timer for engaged sessions to the value of your choice.
Here is the detailed video guide on how to adjust the timer for engaged sessions:
What Is A Good Bounce Rate?
So, it’s not as straightforward as saying, “Example.com has a bounce rate of 43 percent, and example2.com has a bounce rate of 20 percent; therefore, example2.com performs better.”
For example, if you search [what’s on at the cinema…], then land on a website and have to dig through five pages of the site to find what’s showing, the website might have a low bounce rate but will have a poor user experience.
In this case, that’s misleading if you consider a low bounce rate good.
On top of that, what use is there in measuring the bounce rate for the whole website when you have lots of different templates that are laid out and designed in different ways, and you track ‘key events,’ aka conversions, differently?
In most cases, this shows that your marketing is effective and well-targeted, and visitors are engaging with your content and wanting to know more.
Remember, bounce rate is not a ranking factor, but when users navigate deeper into your pages, it is an engagement ranking signal that Google may take into account, according to what Google’s Pandu Nayak said during hearings.
That said, it may make sense to track the number of sessions with two or more pageviews in GA4, which you may want to consider as a KPI when reporting.
How To Set Up A Custom Audience With Multiple Pageviews Per Session
If you want to know how many visitors you have who have more than two page views in a session, you can easily set it up in GA4.
To do that:
- Navigate to Admin.
- Under Data display, navigate to Audiences.
- Click the New Audience blue button on the top right corner.
- Click Create custom audience.
- Set up a name for your audience.
- Select scope to “Within the same session.”
- Select session_start.
- Click And and select “page_views” with the parameter with “Event count” greater than one.
You simply tell it to add to my audience all users who viewed more than two pages within the same session. Here is a quick video guide on how to do that.
You can set up audiences with any granularity, like sessions with exactly two or three pageviews and greater than three pageviews.
Later, you can filter your standard reports using your custom audiences.
How To Do Bounce Rate Reporting And Audit
Next time your boss or client asks you, “Why is my bounce rate so high?” – first, send them this article.
Second, conduct an in-depth bounce rate audit to understand what’s going on.
Here’s how I do it.
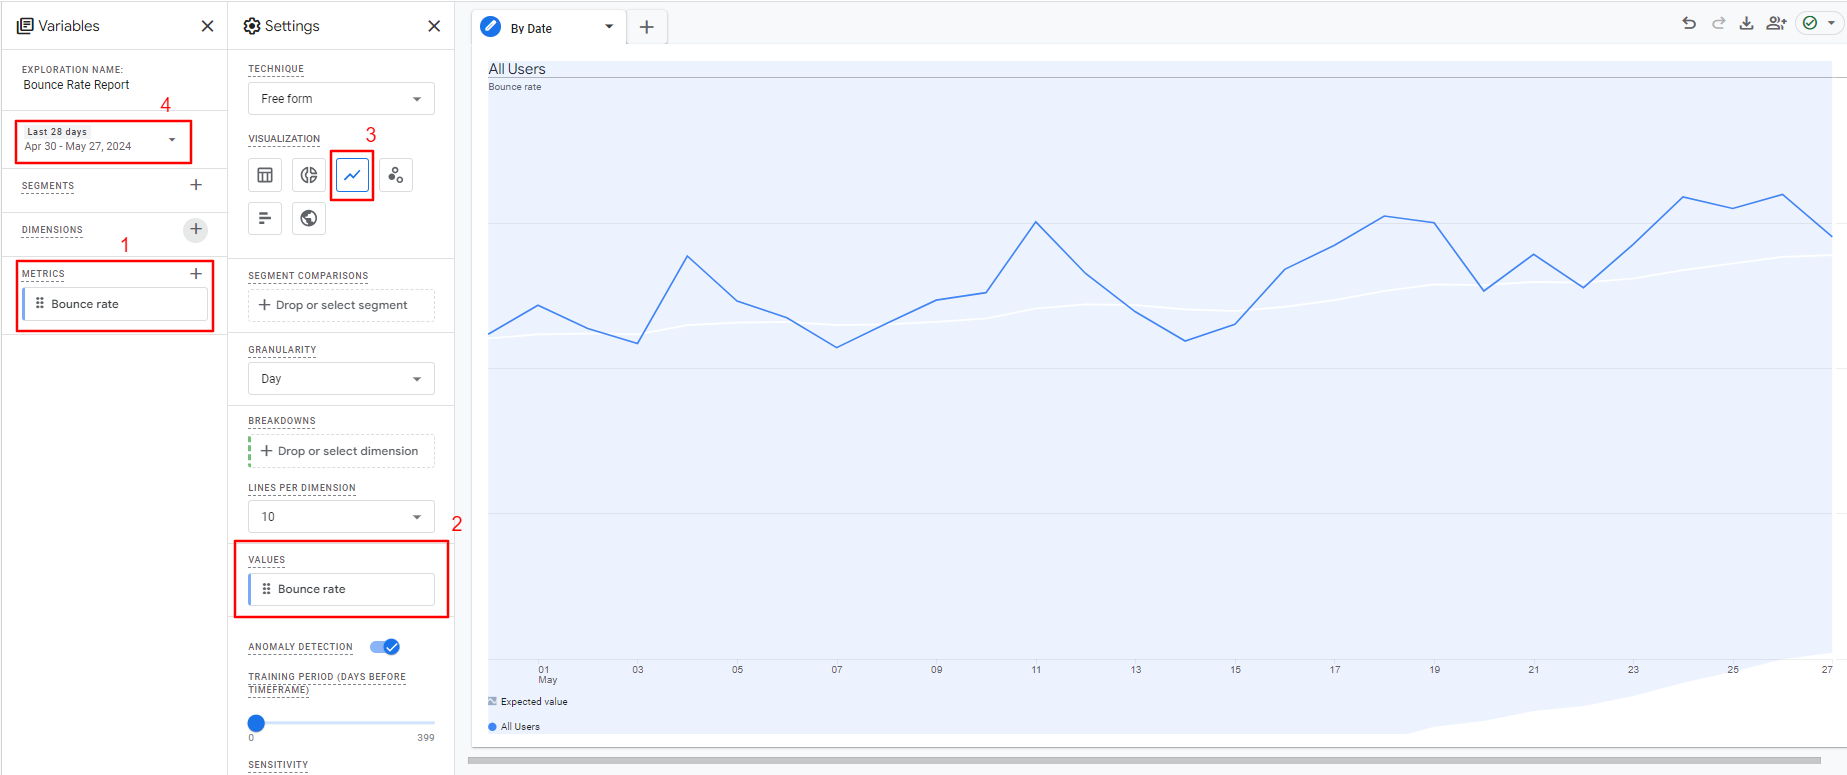
Bounce Rate by Date Range
Look at bounce rates on your website for a particular period. This is the most simple reporting on bounce rate.
To do that:
- Navigate to Explorations on the right-side menu.
- Click ‘Blank’ report.
- From Metrics choose “Bounce rate.”
- Set Values to a “Bounce rate.”
- Under Settings (2nd column), choose visualization type “Line chart.”
- Select the date period of your choice.
-
 How to set up a bounce rate report for the entire website by date range.
If you see spikes in the chart, it may indicate a change you made to the website that influenced the bounce rate.
How To Analyze Bounce Rate On A Page Level
When running a lead generation campaign on many different landing pages, evaluating which pages convert well or poorly is vital to optimize them for better performance.
Another example use case of page-level bounce reports is A/B testing.
To do that:
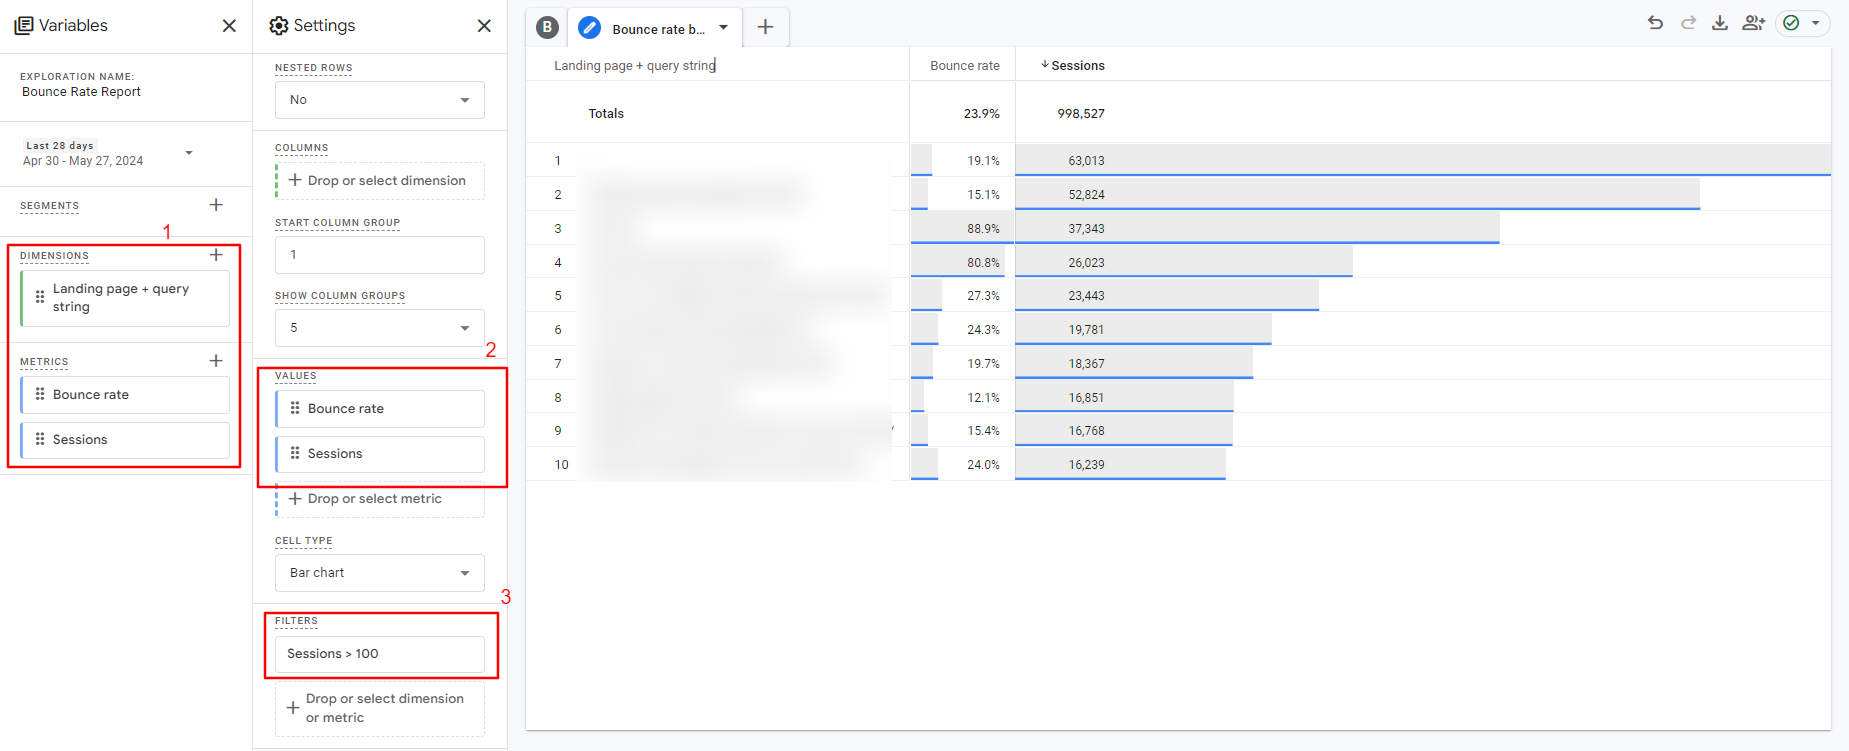
- Navigate to Explorations on the right-side menu.
- Click Blank report.
- From Metrics, choose Bounce rate and Sessions.
- From Dimensions, choose Landing page + query string.
- Under Settings (second column), choose visualization type ‘Table.”
- Set Rows to a “Landing page + query string.”
- Set Values to a “Bounce rate: and “Sessions.”
- Set the filter to include pages with more than 100 sessions ( to ensure the data you’re mining is statistically significant).
- Select the date period of your choice.
Tip: You don’t need to create a new blank exploration report; instead, add another tab to the same report and change only the configuration.
 How to set up page level-bounce rate report.
If we don’t filter by sessions number, you’ll be looking at bounce rates on some pages with only one or two sessions, which doesn’t tell you anything.
Once you’ve done the above, repeat the process per channel to gain an even more rounded understanding of what content/source combinations produce the most or least engaged visits.
How To Analyze Your Bounce Rates By Traffic Channel
Bounce rates can be wildly different depending on the source of traffic.
For example, it’s likely that search traffic will produce a low bounce rate while social and display traffic might produce a high bounce rate.
So you also have to consider bounce rate on a channel level as well as on a page level.
The bounce rate from social and display is almost always higher than “inbound” channels for these reasons:
- When a user is on social media looking through their news feed, they are (often) not actively looking for what we are promoting.
- When a user sees a banner ad on another website, they are (often) not actively looking for what we are promoting.
However, for inbound channels like organic and paid search, it’s logical that the bounce rate is lower as these users are actively searching for what you are promoting.
So, you capture their attention during the “doing” phase of their buyer’s journey (depending on the search term in question).
To dig deeper into each one:
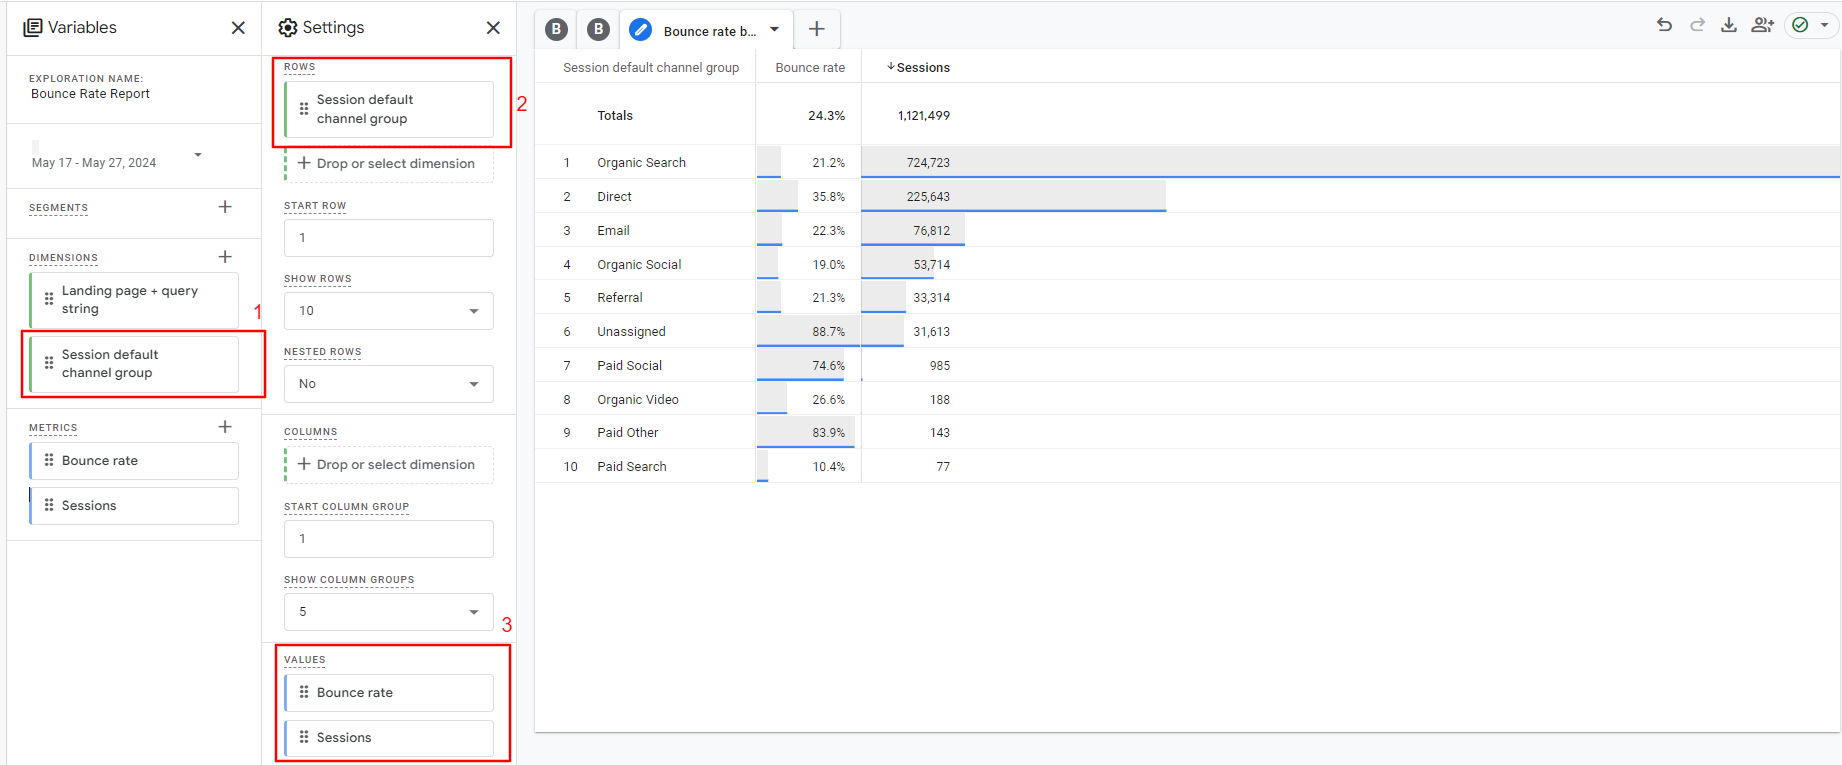
- From Metrics, choose Bounce rate and Sessions.
- From Dimensions, choose Session default channel group.
- Under Settings (second column), choose visualization type Table.
- Set Rows to a Session default channel group.
- Set Values to a Bounce rate and Sessions.
- Select the date period of your choice.
-
 How to set up a bounce rate report by traffic channels.
A little homework: Try to plot a line graph based on the bounce rate for your organic traffic.
Now, you can dig deeper into the data and look for patterns or reasons that one page or set of pages/source or set of sources has a higher or lower bounce rate.
Compile the information in an easy-to-read format, ping it to the powers that be, and head for a congratulatory coffee.
Do You Have The Right Intent?
Sometimes, you’ll find pages that rank in search engines for terms that have more than one meaning.
For example, a recent one I discovered was a page on a website I manage that ranks first for the search term ‘Alang Alang’ (the name of a villa), but Alang Alang is also the name of a film.
The villa page had a high bounce rate, and one reason for this is that some of the visitors landing on that page were actually looking for the film, not the villa.
By doing keyword and competition research to see what results your target keywords produce, you can quickly understand if you have any pages that rank well for terms that could be intended for other topics.
When you identify such pages, you have three options:
- Completely change your keyword targeting.
- Remove the page from the SERPs.
- Overhaul your title and meta description, so searchers know explicitly what the page is about before they click.
How To Increase Website Engagement
Now you’ve figured out what’s going wrong, you’re all set to make some changes.
All of this depends on your study’s findings, so not all of these points are relevant to every scenario, but this should be a good starting point.
Most importantly track custom events as “key events” (conversions) so things like newsletter sign-ups result in Google Analytics classifying that as a non-bounce even if the user didn’t visit a second page.
Is High Bounce Rate Bad?
Hopefully, you now understand why bounce rate isn’t simply “high” or “low”. It depends on many factors, and there is no single answer to the question, “Is high bounce rate bad?”
If you defined your ‘key events’ (conversions) and GA4 settings correctly for your goals, a high bounce ( +90% ) rate is definitely concerning because it means your visitors don’t engage enough with your webpages.
But if you have GA4 on default settings, you can never rely on data because of the reasons we discussed above.
Never assume anything. Do your research and make sure you configure your GA4 account properly to track ‘key events.’
Now, go forth and conquer your bounce rate!
More resources:
Featured Image: eamesBot/Shutterstock
